February 15, 2022 3:24 PM

Headline US PPI for January was 9.7% YoY vs 9.1% YoY expected. The December print was revised higher for December from 9.7% YoY to 9.8% YoY. The core PPI for January, which excludes the volatile food and energy components, rose 8.3% YoY vs 7.9% YoY expected and 8.3% YoY in December. Both prints were much higher than expected, as inflation data continues to soar. Recall that CPI data for January released last week was also higher than expected, at 7.5% YoY vs 7.3% YoY expected and 7% YoY in December. St Louis Fed President Bullard has been on the wires over the past few days discussing how the favors an increase in key interest rates by 100 bps by July, which would imply either a 50bps hike at a meeting prior to that date or an inter-meeting hike. He also said the he favors frontloading quantitative tightening in order to end accommodation. The PPI data for January helps to reinforce Bullard’s stance.
The US Dollar Index (DXY) has been moving higher in an upward sloping channel since May 2021. In late November, the DXY made a false breakout above the channel, and moved back inside. Often as we see, when there is a false breakout on one side of a channel, price moves to retest the opposite side of the channel. The bottom trendline of the channel was tested on January 13th, and the US Dollar Index has been trading within the upward sloping channel since.
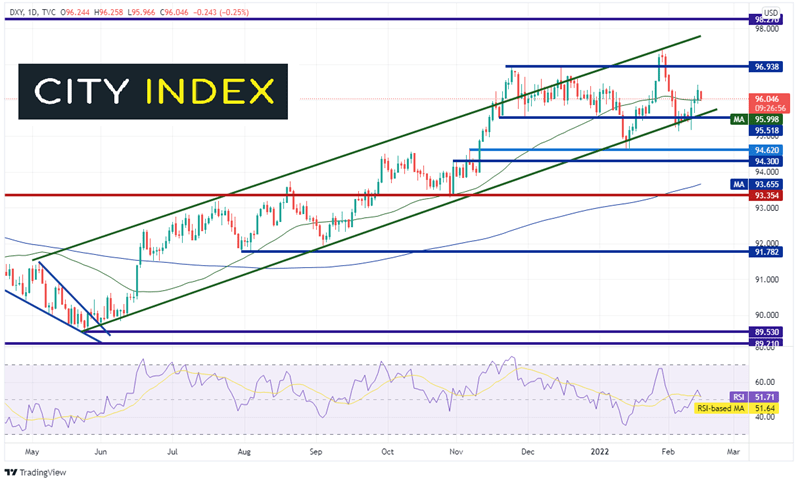
Source: Tradingview, Stone X
Trade DXY now: Login or Open a new account!
• Open an account in the UK
• Open an account in Australia
• Open an account in Singapore
On a 240-minute chart, DXY has been trading in a symmetrical triangle since the beginning of the year between 94.57 and 97.44. More recently, price moved to the 50% retracement level from the highs on January 28th to the lows on February 4th, near 96.29. Resistance is just above at the February 14th highs of 96.43, which is also the downward sloping trendline of the triangle. Above there is the 61.8% Fibonacci retracement level from the same timeframe, and then horizontal resistance at 96.98. The January 28th highs cross above at 97.44. Support is near today’s lows and the 50 Day Moving Average at 96.00 (see daily), then horizontal support and the upward sloping trendline of the long-term channel (see green line on daily) near 95.71. Below there is the bottom trendline of the channel near 95.35, then the lows of February 4th at 95.13.
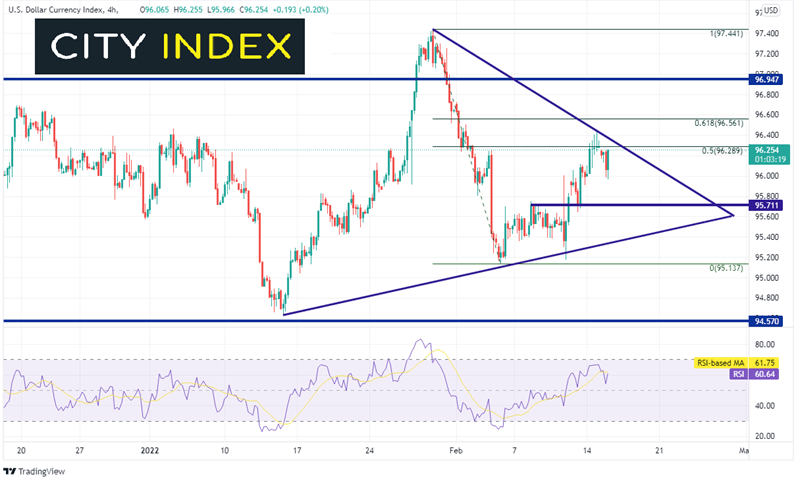
Source: Tradingview, Stone X
The US PPI was much stronger than expected. St Louis Fed President Bullard has made his hawkish stance known and is looking for a 50bps hike soon, and 100bps buy July 1st. if other Fed members agree with his position that a 50bps hike is needed soon, the DXY could be making new near-term highs sooner rather than later!
Learn more about forex trading opportunities.
Latest market news
Yesterday 01:32 PM
Yesterday 09:35 AM
Yesterday 07:23 AM
Yesterday 04:48 AM
Yesterday 12:17 AM
July 25, 2024 10:39 PM
Latest Trade Ideas articles

Yesterday 09:35 AM

Yesterday 12:17 AM

July 25, 2024 10:39 PM

July 25, 2024 05:30 PM