


February 10, 2022 4:47 PM
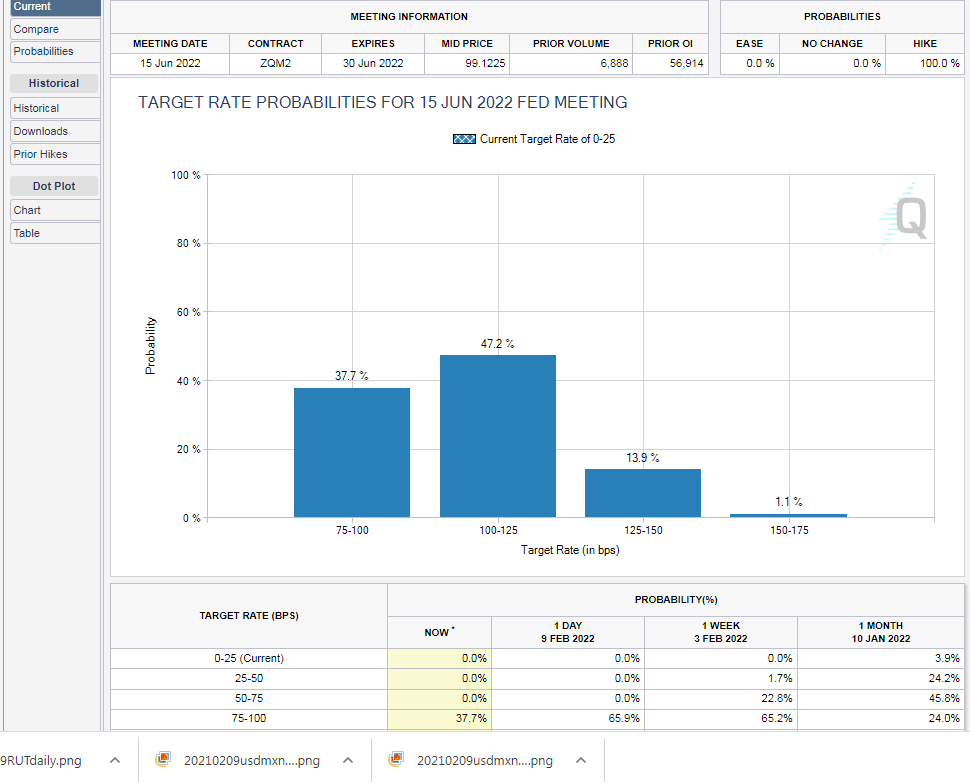
The January US CPI print was 7.5% YoY vs and expectation of 7.3% YoY and 7.0% YoY in December. This was the highest level since February 1982. In addition, the Core Inflation Rate, which excludes volatile food and energy prices, was up 6% YoY in January vs 5.9% YoY expected and 5.5% YoY in December. (See our CPI Preview here.) According to the CME Fedwatch tool, markets are now pricing in nearly a 50% chance of a 50bps hike in March. Before the CPI data, chances were in the in the 33% range. In addition, markets are now pricing in a chance of a full percentage point increase (100bps) by the June 15th meeting.
Source: CME
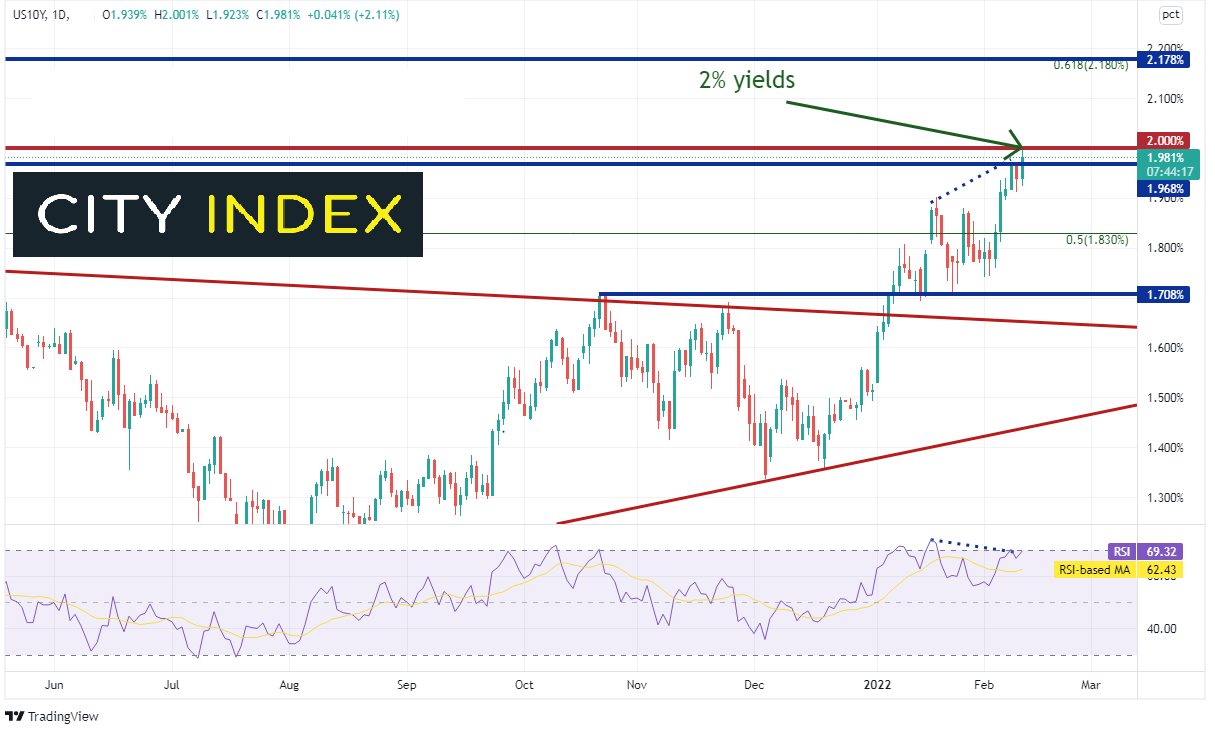
On the release of the data, stocks and bonds sold off, while the US Dollar went bid. The yield on the US 10-year bond traded up to the psychological round number resistance level of 2.00%, its highest level since August 2019.
Source: Tradingview, Stone X
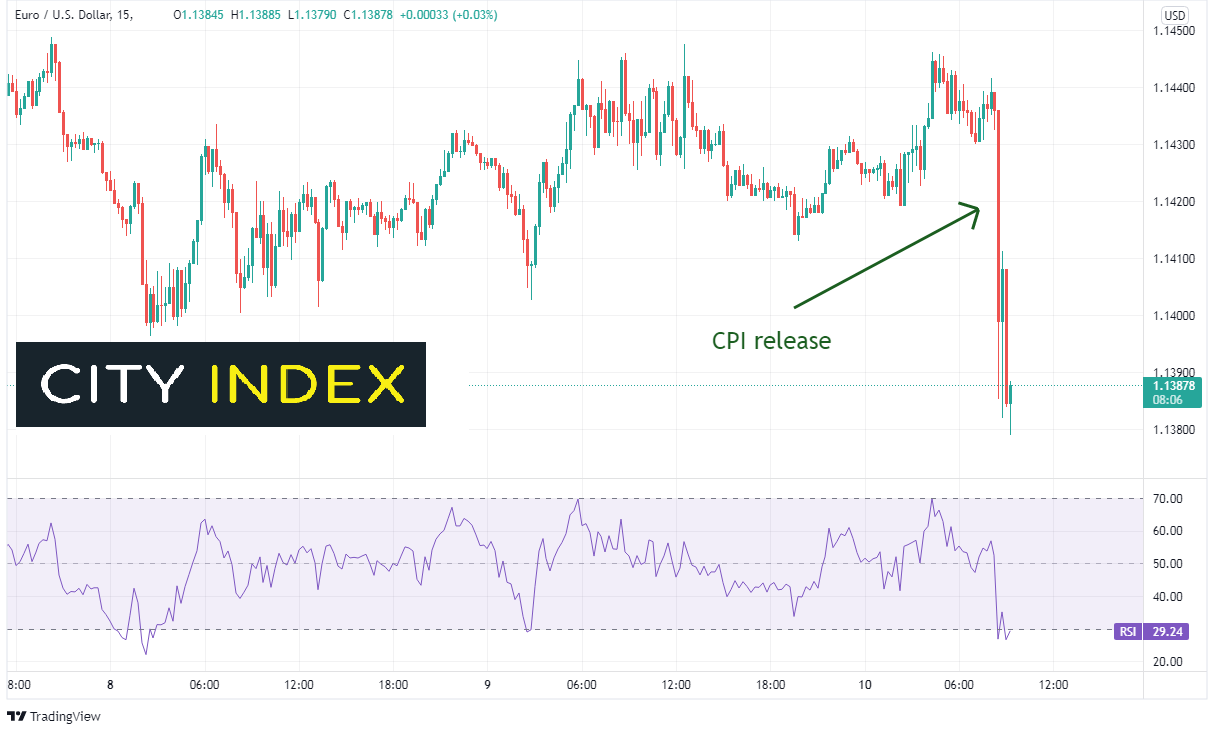
As mentioned, the US Dollar went bid immediately following the CPI release. Therefore EUR/USD moved lower. On a 240-minute timeframe, the pair has been moving higher since posting a false breakdown below the previous lows of November 24th, 2021, reaching at low at 1.1121. However, on February 3rd after the slightly hawkish ECB meeting (previously a dovish stance), EUR/USD moved aggressively higher, reaching a near-term high of 1.1484. 1.1490/1.1500 has been long-term resistance. The pair then pulled back in a flag formation and today, touched horizontal support and the trendline for the bottom of the flag at 1.1376.
Source: Tradingview, Stone X
Trade EUR/USD now: Login or Open a new account!
• Open an account in the UK
• Open an account in Australia
• Open an account in Singapore
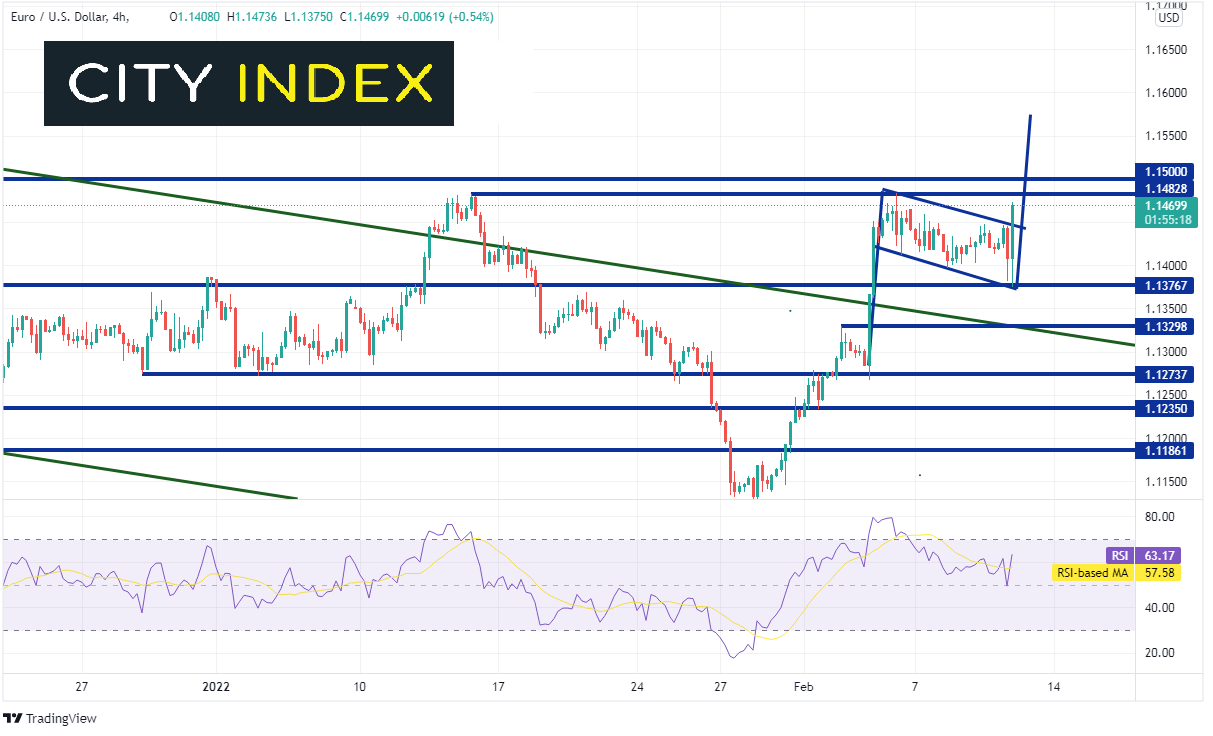
EUR/USD stayed within the flag after holding the support and reversed to the upside, breaking above the formation. However, price is approaching a resistance zone between 1.1482 and 1.1500. If EUR/USD can break above, price many be on its way to the flag target near 1.1575. First support is at the top trendline of the flag near 1.4455, then the bottom of the flag near 1.1376. If price breaks below there, horizontal support crosses at 1.1330.
Source: Tradingview, Stone X
The CPI data for January was strong, and markets were quick to recognize it! However, how much longer could inflation be sustained at this level? Will the Fed hike 50bps at the March meeting to help stem the rise of inflation? With the FOMC meeting a little over a month away, traders should also be prepared, just in case the Fed decides to “jump the gun” with an unexpected intra-meeting rate hike!
Learn more about forex trading opportunities.
Latest market news
Yesterday 03:30 PM
Yesterday 01:23 PM
Yesterday 11:00 AM
Yesterday 08:15 AM
Latest Trade Ideas articles
Yesterday 11:00 AM
Yesterday 08:15 AM
Yesterday 05:45 AM