September 29, 2021 7:31 AM
US Dollar Index (DXY) reaches new 2021 highs
The US Dollar Index (DXY) had been on a nice run since early September leading into last week’s FOMC statement. Although Powell and gang appeared to be on the more hawkish side, the DXY had sold off on what seemed like a “Buy the rumor, sell the fact” type of trade. However, as markets began to decipher the language over the next few days, traders decided Powell was more hawkish than expected during the press conference, using such phrases as “tapering could conclude by the middle of next year” and “Many of the FOMC feel substantial further progress test on employment test has been met. MY OWN VIEW IS THAT IT IS ALL BUT MET.” Volatility ensued into the close that day, however DXY bulls continued to buy the US Dollar dips moving forward.
What is the US Dollar Index (DXY)?
On Thursday, the DXY closed at highest level in 2021, reaching highs not seen since early November 2020! The US Dollar made a 2021 low early in January at 89.20 and moved to a high on March 31st at 93.44. The pair fell back and tried to re-test the January lows, reaching 89.53. This created a descending wedge (bullish) and price broke higher out of the wedge. On August 20th, the DXY reached a new yearly high at 93.72! Today, the DXY once again made new highs for the year, reaching as high as 93.89 thus far! And there still appears to be plenty of room to go. Next level of resistance isn’t until the November 2020 highs at 94.285 and then and upward sloping trendline dating back to April 2011 near 94.40. Above there are the highs from September 2020 at 94.74!
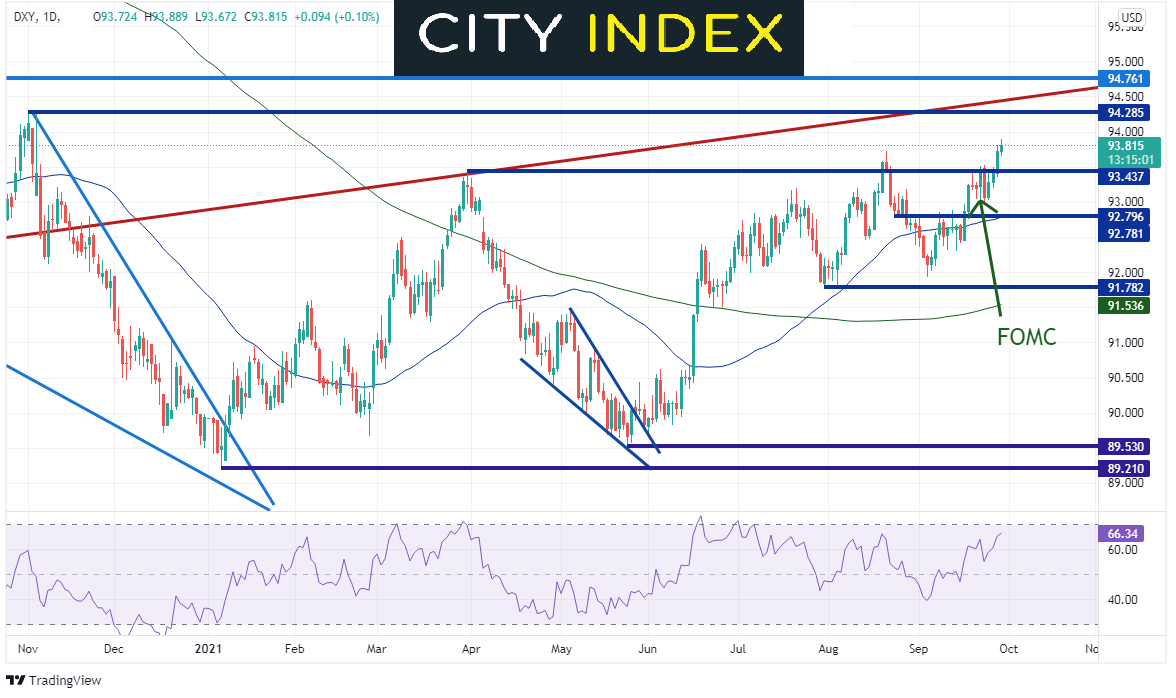
Source: Tradingview, Stone X
As the Euro makes up 57% of the US Dollar Index, one would expect the EUR/USD to move in the opposite direction from the DXY. EUR/USD reached a new yearly low today at 1.1656 thus far, taking out the lows from August 20th at 1.1664. If EUR/USD is to continue lower, there is a confluence of support at the lows of November 4th, 2020 and the 127.2% Fibonacci retracement from the August 20th lows to the September 3rd highs, between 1.1597 and 1.1602. Below there is the 161.8% Fibonacci extension from the same timeframe at 1.1512 and horizontal support dating back to March 2020 at 1.1495. Resistance above on the daily timeframe is at a confluence of horizontal resistance and the 50 Day Moving Average between 1.1770 and 1.1778. Above there is a long-term upward sloping trendline from the September 3rd highs at 1.1908.
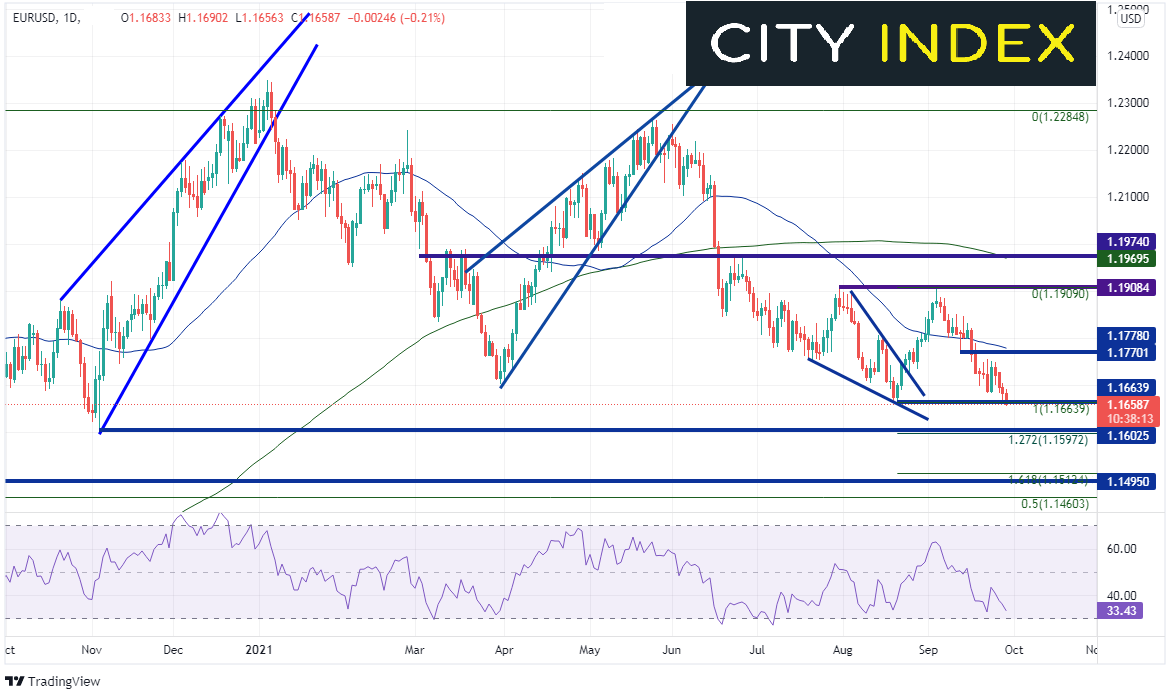
Source: Tradingview, Stone X
Trade EUR/USD now: Login or Open a new account!
• Open an account in the UK
• Open an account in Australia
• Open an account in Singapore
With a hawkish Fed, the DXY has room to run higher. The next meeting isn’t until November 3rd, at which time the FOMC is almost sure to announce tapering will begin (barring a terrible NFP print next Friday). The ECB has been rather neutral. Therefore, unless the ECB changes their tune, we may see more EUR/USD weakness.
Latest market news
Yesterday 01:32 PM
Yesterday 09:35 AM
Yesterday 07:23 AM
Yesterday 04:48 AM
Yesterday 12:17 AM
July 25, 2024 10:39 PM
Latest DXY articles

July 22, 2024 09:30 AM

July 17, 2024 11:18 PM

July 15, 2024 11:20 PM

July 12, 2024 10:38 AM