March 7, 2022 9:25 PM

On February 11th, the US announced that Russia could invade Ukraine any day. Since then, the US Dollar Index has moved from a low on February 11th of 95.64 to a high today of 99.42, a move of nearly 4% in less than a month. The US Dollar, the Japanese Yen, and gold are a few examples of safe haven assets that investors buy when risk moves lower. The markets hate uncertainty. Therefore, with the uncertainty surrounding the onset of the Russia/Ukraine conflict, stocks began moving lower and sentiment moved from “risk-on” towards “risk-off”. Flows began moving into the DXY.
However, war isn’t the only reason that the DXY is moving higher. It is also moving higher due to inflation and interest rate expectations. The higher the inflation, the higher the cost of money and the greater the expectation that the Federal Reserve will hike interest rates. The US releases February CPI (Consumer Price Index, a key measure of inflation) on Thursday. Expectations are for a reading of 7.9% YoY for February. If this print is “as expected”, it would mean that prices have risen nearly 8% from one year ago. Fed Chairman Powell has already said that the FOMC will hike rates on March 16th. However, investors expect more to come, thus pushing the price of DXY higher.
How do interest rates affect financial markets?
The US Dollar Index has been moving higher since May 2021 in an orderly channel. The index briefly traded above the top trendline of the channel in late November to 96.94, only to move back inside channel. When price fails to break above one side of a channel, it often moves to test the other side of the channel. Indeed, price moved back inside the channel and tested the bottom trendline in January, near 94.66. Since then, price continued higher. On Friday, the DXY closed back above the top trendline of the channel and above horizontal resistance. Today, it continued higher, breaking through additional horizontal resistance, as well as the 161.8% Fibonacci extension from the high of January 28th to the low of February 4th near 98.87. If price is to continue higher, if must pass through the psychological round number resistance level at 100.00, horizontal resistance at 100.87, and the March 2020 highs of 102.99. However, notice the RSI is in overbought territory, indication the DXY may be ready for a pullback.
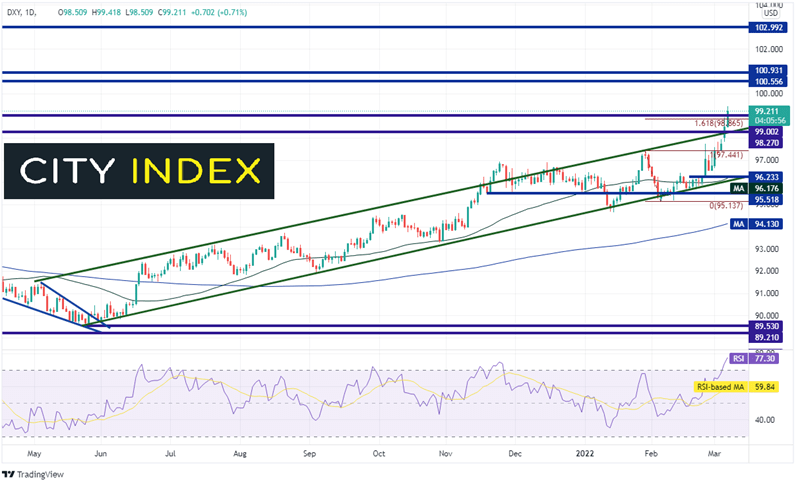
Source: Tradingview, Stone X
Trade the DXY now: Login or Open a new account!
• Open an account in the UK
• Open an account in Australia
• Open an account in Singapore
On a 240-minute timeframe, near-term support levels come into play. The first support is the top trendline of the long-term channel (green) and horizontal support near 98.27. Below there is horizontal support near 97.82, then the January 28th highs at 97.44.
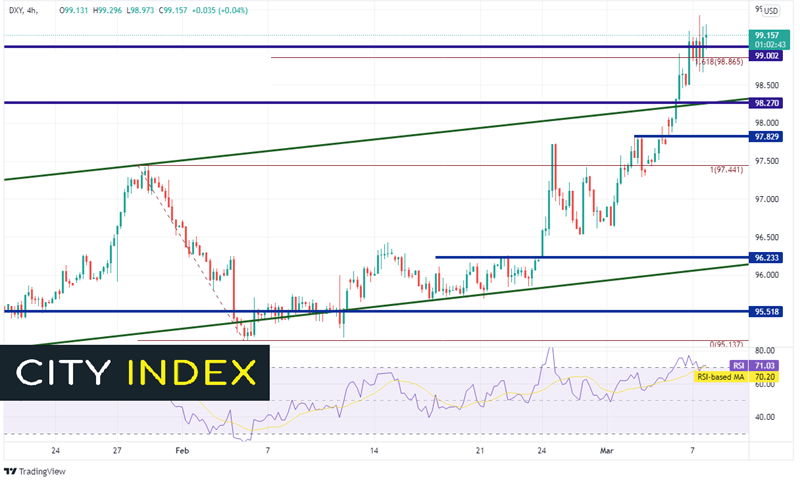
Source: Tradingview, Stone X
There are plenty of reasons the DXY can continue higher, whether it’s a flight to safety, higher inflation, or for technical reasons. However, traders need to watch the headlines. Any talks of a breakthrough in diplomacy which could lead to a ceasefire (or a lower than expected CPI on Thursday) could send the DXY lower.
Learn more about forex trading opportunities.
Latest market news
Yesterday 01:32 PM
Yesterday 09:35 AM
Yesterday 07:23 AM
Yesterday 04:48 AM
Yesterday 12:17 AM
July 25, 2024 10:39 PM
Latest Trade Ideas articles

Yesterday 09:35 AM

Yesterday 12:17 AM

July 25, 2024 10:39 PM

July 25, 2024 05:30 PM