August 3, 2022 8:55 PM

Over the past few days, Fed member after Fed member has been on the wires talking about how the Federal Reserve still has a long way to go to tame inflation. They talked about the need to get inflation to target, even at the expense of a strong labor market. San Francisco Fed President Daly said that she would start with 50bps for September because that is what the data is telling her. But she went on to say that “if we just see inflation roaring ahead undauntedly, the labor market showing no signs of slowing, then we’ll be in a different position where a 75bps increase might be more appropriate”. However, stock indices don’t quite see it that way as they continue to bust a move higher.
Everything you need to know about the Federal Reserve
Markets seems to think that the PMIs released over that last few days show signs of a slowing world economy. In addition, inflation data seems like it may have peaked. Housing prices are lower, and some price components of manufacturing data were lower as well, such as the Philly Fed Manufacturing Index and the ISM Manufacturing Index. Does the Fed have it wrong? Bad data is good data for the stock market as it means that the Fed will raise rates as a slower pace, and possibly even stop all together by Q1 of 2023! However, the next Fed meeting isn’t until the end of September, so there is a lot more data to see before then. For now, stock markets seem to be betting on a less hawkish Fed at the September meeting.
The S&P 500 has been moving lower since the beginning of the year. On June 17th, the large cap index made a new low for the year at 3636, posting a false breakout below the bottom trendline of a descending wedge. As is often the case, when price fails to break one side of a pattern, it moves to test the other side of the pattern. On July 19th, the S&P 500 broke aggressively above the top, downward sloping trendline of the descending wedge. Today, price broke above the 50% retracement level from the highs of March 29th to the lows of June 17th, near 4137.4. In addition, if today’s price closes above 4140.6, it will have formed a bullish engulfing pattern, indicating a possible further move higher. The next resistance is at the highs of May 30th at 4214.6, then the 61.8% Fibonacci retracement level of the recently mentioned timeframe near 4255.1. Above there, price can move to the highs of May 4th at 4308.6. However, if the Fed turns out to be correct, and inflation is still increasing, stocks may turn lower. The first horizontal support is at 3919.8. Below there, price can fall to a confluence of support at the top, downward sloping trendline of the long-term descending wedge and the lows of July 14th, near 3721.6. The next support level is the low from June 17th at 3638.8.
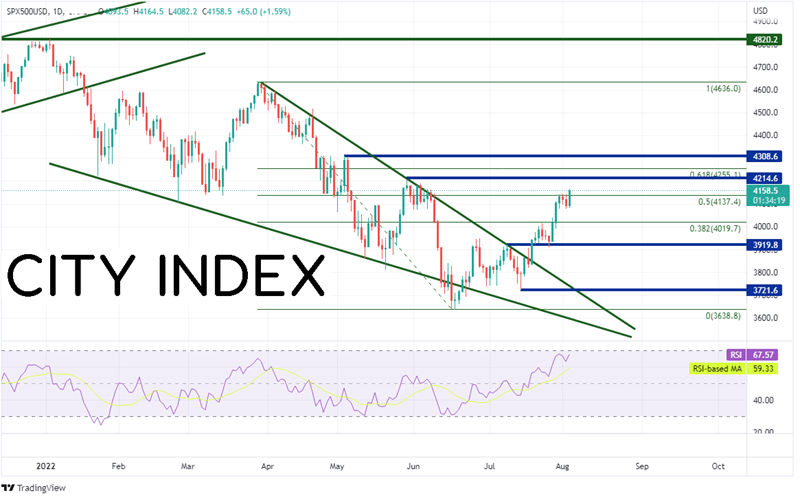
Source: Tradingview, Stone X
Trade the S&P 500 now: Login or Open a new account!
• Open an account in the UK
• Open an account in Australia
• Open an account in Singapore
Other US stock indices such as the NASDAQ 100 and the Russell 2000 have similar patterns. Both indices broke out of descending wedges and, today, broke above the 50% retracement level from the highs of March 29th to the lows of June 16th. Will stock indices continue to move higher? We may have to wait until Friday’s NFP data to find out!
Learn more about index trading opportunities.
Latest market news
Yesterday 01:32 PM
Yesterday 09:35 AM
Yesterday 07:23 AM
Yesterday 04:48 AM
Yesterday 12:17 AM
July 25, 2024 10:39 PM
Latest Trade Ideas articles

Yesterday 09:35 AM

Yesterday 12:17 AM

July 25, 2024 10:39 PM

July 25, 2024 05:30 PM