

The stochastic oscillator is a technical analysis tool which compares the price range of an asset over a given time period to its closing price. Learn more about how it works and how to use it for trading.
- What is the stochastic oscillator?
- How is the stochastic oscillator calculated?
- How to use the stochastic oscillator
- Limitations of the stochastic oscillator
- Relative strength index vs stochastic oscillator
- MACD vs stochastic oscillator
- Stochastic oscillator FAQs
What is the stochastic oscillator?
The stochastic oscillator is a momentum indicator which compares the closing price of an instrument to the range of its price over a certain period of time. It is a two-line indicator that can be applied to any chart, and it has a range value from 0 to 100.
It is used to generate trading signals, determine possible trading opportunities such as overbought and oversold conditions, or forecast entry and exit points.
The usual timeframe for the stochastic oscillator is 14 time periods (hourly, daily, etc.). A reading of 0 represents the lowest point of the given trading range, while a reading of 100 indicates the highest point during the designated time period.
How is the stochastic oscillator calculated?
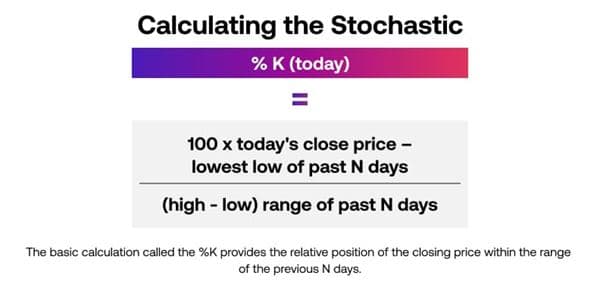
The stochastic oscillator is calculated by analysing how long the price can maintain its current trend. To do this it uses two lines, the %K and %D, which usually appear on a sub-chart below the price chart.
The %K line compares the market’s close for the day to its trading range over a certain period (usually 14 days). It is represented as a percentage of the difference between its highest and lowest values over this time.
The %D line represents the -period average of %K (although this could be adjusted to other settings such as a 5-period average instead). This line is used to show the longer-term trend for current prices, as well as to show whether the current price trend is continuing for a sustained period of time.
The range is the highest high of the past number of days (not including today) minus the low of the past number days. Dividing by the range creates a value from 0 – 100.
Stochastic oscillator example
Let's say we want to calculate the stochastic oscillator for a given stock over a 14-day period. Here is a step-by-step example:
- Gather the necessary data
Obtain the closing prices of the stock for the past 14 trading days
- Identify the highs and lows
Find the highest closing price and the lowest closing price during the 14-day period - Calculate the %K value
The %K value represents the current closing price's position in relation to the range between the highest high and lowest low. To calculate it, use the formula above.
For example, if the current closing price is £50, the lowest low is £40, and the highest high is £60, the %K value would be: %K = ((£50 - £40) / (£60 - £40)) * 100 = (10 / 20) * 100 = £50 - Calculate the %D value
Let's assume we use a 3-day moving average. To calculate %D, take the average of the last 3 %K values. In this case, you would consider the %K values from the previous 3 days and calculate their average.
For instance, if the %K values for the past 3 days were 40, 60, and 50, the %D value would be: %D = (40 + 60 + 50) / 3 = 50
How to use the stochastic oscillator
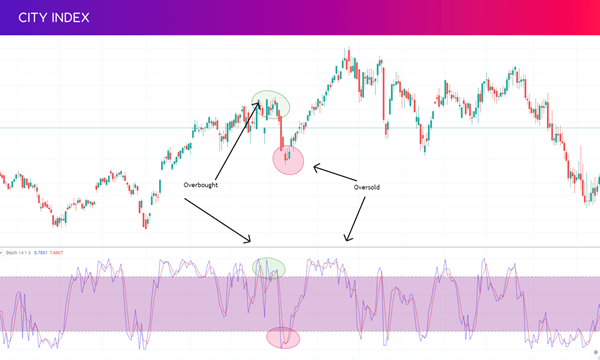
The stochastic oscillator is most commonly used to find overbought or oversold signals, divergences and crossovers. With the help of other technical analysis tools such as moving averages, the stochastic oscillator can help to improve trading accuracy and identify advantageous entry and exit points.
Overbought conditions
Stochastic readings above 80 are regarded as a sign of the market being overbought, meaning the asset’s price has become inflated above what is considered its true value.
If the stochastic indicator falls below 80 – and %K crosses below %D – this would trigger a signal to sell.
Oversold conditions
A reading of 20 and below is considered as oversold, meaning the asset’s price has fallen below what is considered its true value.
If the indicator rises up from below 20 – and %K crosses above %D – this could be seen as confirmation to buy the market.
Nonetheless, overbought and oversold signals from the stochastic oscillator can be misleading. The price of an instrument won’t fall automatically just because it is overbought. Equally, an instrument won’t rise in price just because it is oversold. Overbought and oversold simply mean the price is trading near the top or bottom of its range.
Divergences
A divergence occurs when momentum is going in one direction and the price in another. Should the stochastic oscillator fail to confirm momentum is going in the same direction as the price, this means that the trend may be about to reverse.
A bullish divergence occurs when an instrument’s price makes a lower low, but the stochastic indicator touches a higher low. This signals that selling pressure has decreased and a reversal upwards could be about to happen.
A bearish divergence occurs when an instrument’s price makes a higher high, but the stochastic indicator hits a lower high. This signals that upward momentum has slowed and a reversal could be about to take place.
An important point about trading with stochastic divergence is that decisions should not be made until divergence is confirmed by an actual turnaround in the price. An instrument’s price can continue to rise or fall for a long time. Therefore, the stochastic oscillator should form just one part of a technical analysis strategy, as a turnaround in price can be confirmed or invalidated by another technical indicator.
Crossovers
A crossover refers to the point at which the fast stochastic line (the %K line) and the slow stochastic line (the %D line) intersect. When the %K line intersects the %D line and goes above it, this is a bullish scenario which could generate a buy signal. On the other hand, the %K line crossing from above to below the %D stochastic line suggests a bearish scenario generating a sell signal.
Remember, these signals are not guaranteed, as markets can be affected by a variety of factors. This could lead to the indicator generating false signals.
Limitations of the stochastic oscillator
The stochastic oscillator has some limitations, namely its tendency to produce false signals. This happens when a trading signal is generated by the indicator, yet the price does not actually follow through, and is especially common during volatile market conditions.
This is why it is important to confirm the trading signals with indications from other technical indicators such as the relative strength index (RSI).
In the case of opening a position on a false signal, we can use risk management strategies to minimise the loss as much as possible. These strategies include actions such using stop loss orders, which will automatically close a trade if the price falls below a level chosen by you.
How to start using the stochastic oscillator as a trading strategy
To start using the stochastic oscillator as a trading strategy follow these steps:
- Open your City Index account and add some funds
- Log in to our award-winning Web Trader platform or download our mobile trading app
- Select an asset and view its price on industry-leading TradingView charts
- Choose to ‘buy’ to go long, or ‘sell’ to go short
Alternatively, you can use the stochastic oscillator to analyse our full selection of stocks, indices, forex, commodities and more with a City Index demo account.
This is a great option for technical analysis beginners who want to practice trading first without putting up any capital – instead, you’ll be trading with virtual funds and zero risk.
How to set up the stochastic oscillator on the City index platform
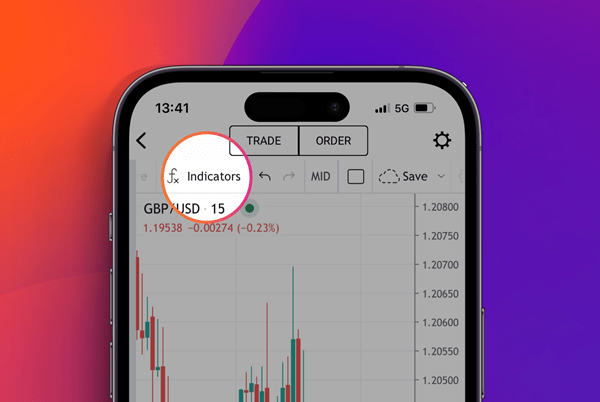
To set up the stochastic oscillator on our trading platform, all you need to do is open the chart for your chosen market and select the indicator list at the top of your chart.
Then just search for the stochastic oscillator and select it from the drop down.
The process is the same whether you’re looking to use our Web Trader platform or mobile app – but if you’re using the app, you just need to hit the ‘full screen’ option in the bottom left corner to see your full chart menu.
Relative strength index vs stochastic oscillator
The relative strength index (RSI) and stochastic oscillator are both price momentum indicators that are widely used in technical analysis. Although they are regularly used together, they are different tools. The RSI was designed to measure the speed of price movements, while the stochastic oscillator formula works best in consistent trading ranges.
MACD vs stochastic oscillator
While the stochastic oscillator compares a stock's closing price to its price range over a certain period of time, the MACD is the formation of two moving averages diverging from and converging with each other. This combination is highly effective if used to its fullest potential.
Stochastic oscillator FAQs
How do you read a stochastic oscillator?
The stochastic oscillator represents recent prices on a scale of 0 to 100, with 0 representing the lower limits of the recent time period and 100 representing the upper limit. A stochastic indicator reading above 80 indicates that the asset is trading near the top of its range, and a reading below 20 shows that it is near the bottom of its range.
Learn more about our trading tools
What two lines make up the stochastic oscillator?
Stochastic oscillators display two lines: %K, and %D. The %K line compares the lowest low and the highest high of a given period to define a price range, then displays the last closing price as a percentage of this range. The %D line is a moving average of %K.
Learn more about the indicators available on our platform
Can I use other technical indicators together with the stochastic oscillator?
Other momentum indicators such as the relative strength index (RSI) or the moving average convergence divergence (MACD) can also be used to complement the stochastic oscillator. Either of these commonly used momentum indicators can be used to look for signals that are in agreement with the stochastic oscillator.
Learn about the best technical indicators
Latest market news
Yesterday 10:28 PM
Yesterday 04:00 PM
Yesterday 01:03 PM
Yesterday 12:00 PM
Yesterday 10:37 AM
Latest Technical Analysis articles


Yesterday 10:37 AM

May 7, 2024 12:26 PM

May 6, 2024 02:23 PM