

The relative strength index (RSI) is a technical analysis tool that is used to measure price movement. It is a popular indicator among traders, so let’s dive into what it is and how to use it.
- What is the RSI
- How to use the RSI
- How is the RSI calculated?
- RSI trading strategies
- RSI vs MACD
- RSI limitations
- FAQs
What is the RSI?
The relative strength index (RSI) is a momentum indicator used in technical analysis which measures the speed and change of price movements. It compares the average number of days that the price of an instrument closed up to the average number of days that it closed down.
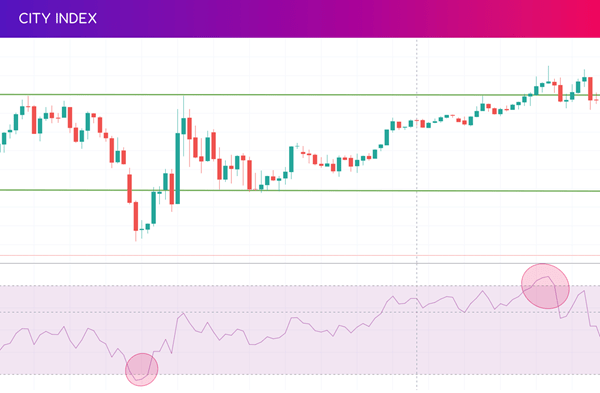
The RSI is typically plotted beneath the price chart, and the common timeframe is 14 days – but it can be used on multiple timeframes ranging from minutes to hours, days and even weeks. For example, long-term traders might choose to set their charts to a 14-week view instead. It is displayed as an oscillator (a line graph) on a scale of 1 to 100.
It is a popular indicator because it is a fairly comprehensive and simple tool that helps predict the price behaviour of a chosen instrument, validate trends or complement analysis in conjunction with other technical indicators.
How to use the RSI
The RSI can be used to help traders find overbought or oversold situations, find divergences, validate trends and trend reversals or help them predict the price behaviour of a given instrument. Typically, the RSI is used with a 9, 14, or 25 calendar day (7, 10, or 20 trading day) period against the closing price of an instrument. If you add more days to the calculation, the value is considered less volatile.
Oversold conditions
Generally, when the RSI value falls below 30, the market is considered to be oversold. This suggests that the instrument may be undervalued and a price rebound could be on the horizon. Traders who see indications that an instrument is oversold might use this as a signal to buy.
Overbought conditions
When the RSI value rises above 70, the market is generally considered to be overbought. This can happen when the price reaches a point of resistance. This suggests a situation where the market could reverse and head lower, so traders who see indications that an instrument is overbought might use this as a signal to sell.
For example, an RSI of 65.75 suggests that the stock is neither overbought nor oversold. It indicates a relatively neutral position. However, if the RSI calculated was higher, such as 77.16, this would suggest a signal to sell because the instrument would find itself in an overbought position.
Divergences
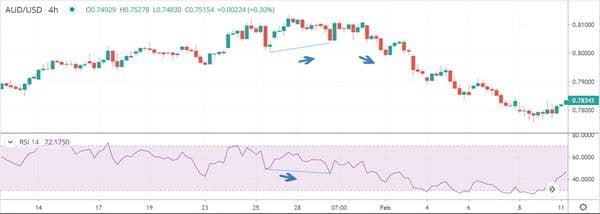
Another way to trade with RSI is to look for divergence between the RSI and the market price. An RSI divergence occurs when price moves in the opposite direction to the RSI.
A bullish divergence (also called a positive divergence) occurs when the RSI hits a “higher low”, but the price hits a “lower low”. In other words, when the price is drifting lower, but the RSI is edging higher.
A bearish divergence (also called a negative divergence) occurs when the RSI hits a “higher high”, but the price hits a “lower high”. In other words, when the price is going higher, but the RSI is drifting lower.
How is the RSI calculated?
The RSI is calculated by using the average gain and loss over a 14-day period. You can do this by finding the average upward change and the average downward change in a market over the last 14 sessions. Remember that the period is not fixed and can be adjusted depending on the needs of the trader. This is shown in the following formula:
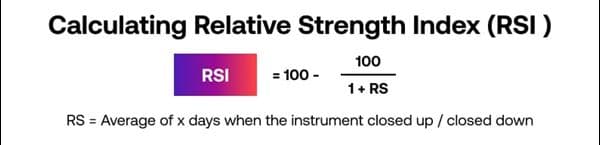
The RSI will look at the price movement on the chart for your chosen period. It will register the changes in price – relative to previous price movements – to show market ‘strength’.
RSI example
Let's say we want to calculate the RSI for a given stock over a 14-day period. Here is a step-by-step example:
- Collect the closing prices of the stock for the last 14 trading days
- Calculate the price change for each day by subtracting the previous day's closing price from the current day's closing price
- Separate the gains and losses. Divide the price changes into two groups: gains and losses. Gains represent positive price changes, while losses represent negative or zero price changes
- Calculate average gains and losses. To do this, sum up all the gains and losses separately and divide them by the chosen period (in this case 14 days)
Average Gain = Sum of Gains / 14
Average Loss = Sum of Losses / 14 - Calculate the relative strength (RS): Divide the average gain by the average loss to obtain the relative strength (RS) value
RS = Average Gain / Average Loss
- Calculate the RSI. The RSI is calculated using the RS value by applying the formula above. For example, if the RS value is 2, the RSI would be:
RSI = 100 - (100 / (1 + 2)) = 100 - (100 / 3) = 100 - 33.33 = 66.67
So, the RSI in this case would be 66.67.
How to set up the RSI on the City index platform
To set up the RSI on our trading platform, all you need to do is open the chart for your chosen market and select the indicator list at the top of your chart.
Then just search for the RSI and select it from the drop down.
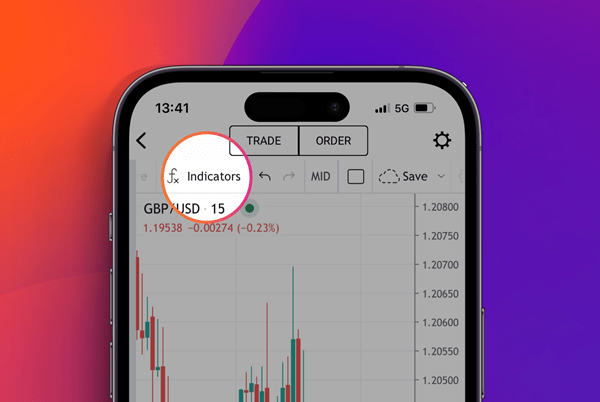
The process is the same whether you’re looking to use our Web Trader platform or mobile app – but if you’re using the app, you just need to hit the ‘full screen’ option in the bottom left corner to see your full chart menu.
RSI trading strategies
RSI can be used for trading all markets and asset classes, from stocks to foreign exchange (forex), with a variety of RSI trading strategies to choose from. A couple of examples include day trading and trend trading.
Day trading with the RSI
Day trading involves buying or selling assets within the same trading day. When day trading with RSI, you are still looking for overbought and oversold signals. While the default RSI setting is 14 periods, day traders may choose lower periods of between 6 and 9, so that more signals are generated.
Trend trading with the RSI
If trend trading, a strategy used with RSI would be to wait for the indicator to signal an overbought condition during an uptrend. The trader then waits for RSI to drop below 30, which signals a long entry (buying to open the position and selling to close it). If the trend remains in place, price will typically recover off this level and move to new highs.
How to start using RSI as a trading strategy
To start using RSI as a trading strategy follow these steps:
- Open your City Index account and add some funds
- Log in to our award-winning Web Trader platform or download our mobile trading app
- Select an asset and view its price on industry-leading TradingView charts
- Choose to ‘buy’ to go long, or ‘sell’ to go short
Alternatively, you can use RSI to analyse our full selection of stocks, indices, forex, commodities and more with a City Index demo account. This is a great option for technical analysis beginners who want to practice trading first without putting up any capital – instead, you’ll be trading with virtual funds and zero risk.
RSI vs MACD
The MACD (moving average convergence divergence) and the RSI are both trend-following momentum indicators. However, the MACD measures the relationship between two EMAs (exponential moving averages), while the RSI measures price-change momentum in relation to recent price movements.
Because the MACD uses moving averages, it can be used to qualify trading signals generated by the RSI indicator. These two indicators are often used together to provide a comprehensive technical picture of a market.
Limitations of RSI
It is important to understand that RSI signals are not 100% accurate and do not always work. Since the indicator displays momentum, it can stay overbought or oversold for a long time when an instrument has significant momentum in either direction. In addition, it does not predict how big or small the following price move will be.
Therefore, the RSI is most useful in a market where the price is alternating between bullish and bearish movements and it is most effective when used alongside other technical indicators.
RSI FAQs
Is RSI suitable for you?
This indicator is useful for traders who are looking to time the market for short-term reversals, to profit from overbought and/or oversold conditions. It is best to use it in combination with other technical indicators in order to build your trading strategy.
Discover the types of trading strategies
Which RSI signals should I look for?
When markets have reached an oversold condition (below 30) a reversal could be around the corner. This is a potential signal which gives traders the opportunity to profit from buying.
On the other hand, when we see a situation where the market has reached an overbought condition (above 70), this means it could reverse and start heading lower, giving traders the opportunity to profit from selling.
Learn more about the RSI
How do I set the RSI indicator?
To set the RSI indicator, choose the desired timeframe and customise the time periods for calculation. Adjust the settings to your trading strategy, which could be using shorter periods of time if you are day trading, or longer periods if you are analysing longer trends.
Learn about the best technical indicators
Latest market news
Yesterday 01:32 PM
Yesterday 09:35 AM
Yesterday 07:23 AM
Yesterday 04:48 AM
Yesterday 12:17 AM
July 25, 2024 10:39 PM
Latest Technical Analysis articles

July 25, 2024 03:59 PM

July 24, 2024 07:26 PM

July 24, 2024 09:55 AM

July 23, 2024 11:58 AM