July 22, 2022 4:14 PM

Mexico released its mid-month CPI report for July which showed that inflation continues to climb, despite continued interest rate hikes by the Bank of Mexico. The headline mid-month inflation rate for July is 8.16% YoY vs an expectation of 8.1% YoY and a reading of 7.88% YoY in June, led primarily by rising food costs. This is the highest level of inflation in 21 years! In addition, the mid-month Core CPI is 7.56% vs an expectation of 7.54% YoY and a reading of 7.47% YoY in June. The increase in inflation continues despite the Bank of Mexico (Banxico) hiking rates 9 times since June of 2021. Banxico last raised rates on June 23rd by 75bps to 7.75%, the highest level since October 2019. The central bank meets again on August 11th and is expected to hike rates by another 75bps, which would bring the policy rate to 8.5%! Note that Banxico doesn’t expect inflation to converge to its 3% target until 2024!
On a weekly timeframe, USD/MXN has been trading under the downward sloping trendline dating to the pandemic highs from April 2020, near 25.7836. However, since November 2020, USD/MXN has been holding above a band of support between 19.5491 and 20.1973. The pair has tested this band may times, only to bounce each time. During the week of May 30th, USD/MXN broke below the bottom of the range, only to bounce the next week and close back inside. As often is the case, when a pair fails to breakdown through one side of a formation, it often moves to test the other side. USD/MXN continued to move higher and test the top, downward sloping trendline near 20.7012 last week. However, the pair failed to close above it and formed a shooting start candlestick formation on the weekly timeframe. This is often a 1 candlestick reversal pattern, which means the pair could be moving lower.
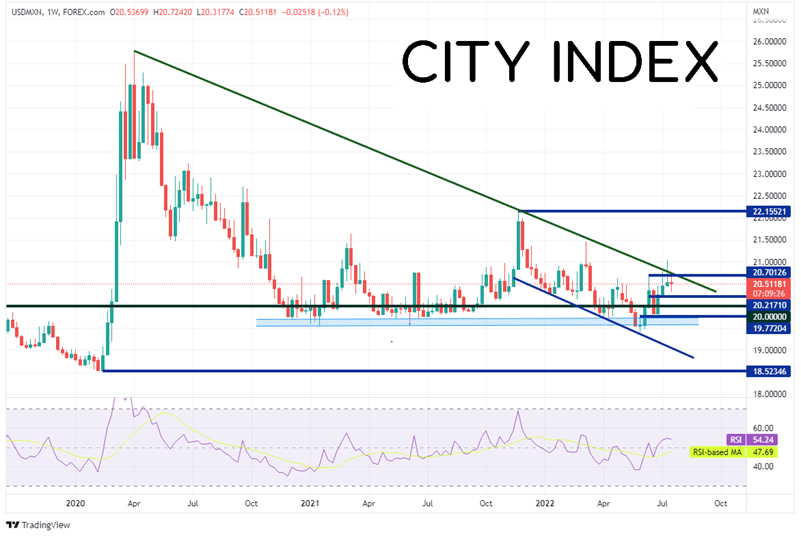
Source: Tradingview, Stone X
Trade USD/MXN now: Login or Open a new account!
• Open an account in the UK
• Open an account in Australia
• Open an account in Singapore
On a daily timeframe, since making a recent high of 22.1539 on November 26, 2021, USD/MXN has been trading in a downward sloping channel. The top trendline of the channel is also the longer-term trendline on the weekly timeframe. As price poked above the trendline on July 12th, USD/MXN was capped by the 61.8% Fibonacci retracement level from the highs of November 26th, 2021 to the lows of May 30th, near 21.1079. As mentioned above, the pair pulled back under the trendline, which now acts as the first level of resistance near 20.7013. Above there, price can move to 61.8% Fibonacci retracement at 21.1079 and then the highs of March 8th at 21.4787. If the resistance holds and price moves lower, the first level of support is at the lows of July 19th at 20.3065, then support near the top of the band at 19.7720. If USD/MXN makes it to the bottom of the band, the next support is the low from May 30th at 19.3338.
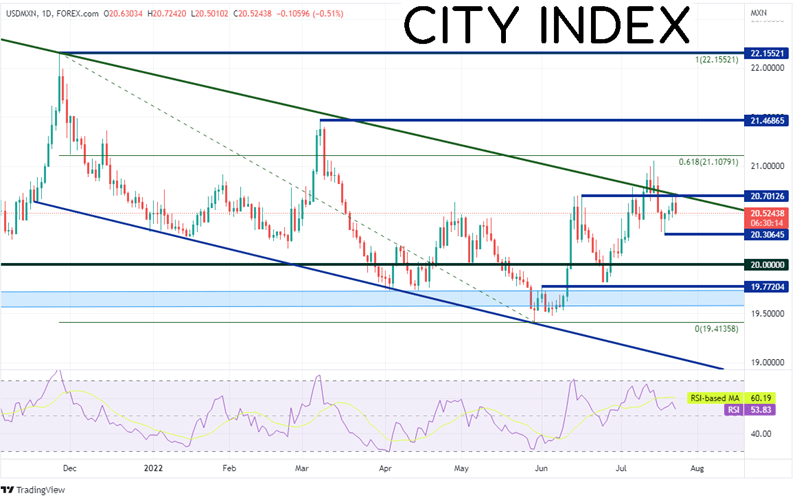
Source: Tradingview, Stone X
With the higher than expected inflation reading for Mexico, the peso may continue to go bid. In addition, expectations are that the Bank of Mexico will be hawkish at its next meeting and hike by 75bps. Note that today’s release of the July PMI for the US was also weaker than expected, putting pressure on the US Dollar. All these factors together may cause USD/MXN to test the support range once again!
Learn more about forex trading opportunities.
Latest market news
Yesterday 01:32 PM
Yesterday 09:35 AM
Yesterday 07:23 AM
Yesterday 04:48 AM
Yesterday 12:17 AM
July 25, 2024 10:39 PM
Latest Trade Ideas articles

Yesterday 09:35 AM

Yesterday 12:17 AM

July 25, 2024 10:39 PM

July 25, 2024 05:30 PM