

- Gold soared to fresh record highs on Friday before unwinding dramatically into the close
- Gold has been mildly bid on Monday following Iran’s attack on Israel
- Geopolitics is not the only factor underpinning gold’s sizzling start to 2024
- Recent price action suggests gold may be due a modest pullback
Big, ugly and unusual given the escalation in geopolitical tensions in the Middle East. You can see why traders are questioning whether the big reversal in gold last Friday may signal we’ve seen a near-term top after a rollicking start to 2024.
Gold showing signs of rally fatigue
While the price action does scream a little ‘blow-off top’, with the price surging to fresh record highs earlier in the session before unwinding spectacularly into the close, it’s probably a little too early to write-off the rally just yet.
As detailed in a note on gold and silver last week, there are numerous factors that explain the sizzling start to the year for precious metals, with geopolitical tensions being only one consideration. And even though the news flow over the weekend could have been much worse, it’s a big call to assume that’s the conclusion to hostilities in the region.
Gold bulls defend uptrend
As seen in the daily chart below, the uptrend gold has been sitting in since late March remains intact with the price continuing to attract bids on dips around these levels. Even though the uptrend in RSI has been broken, indicating waning upside momentum, until we see price break definitively through the uptrend, it’s difficult to get too bearish on bullion right now.
Should the price hold above the trendline, trader can use dips towards this level to enter long positions, allowing for a stop to be placed below for protection targeting a push back to the former record high of $2431.50.
But should that give way $2200 is possible
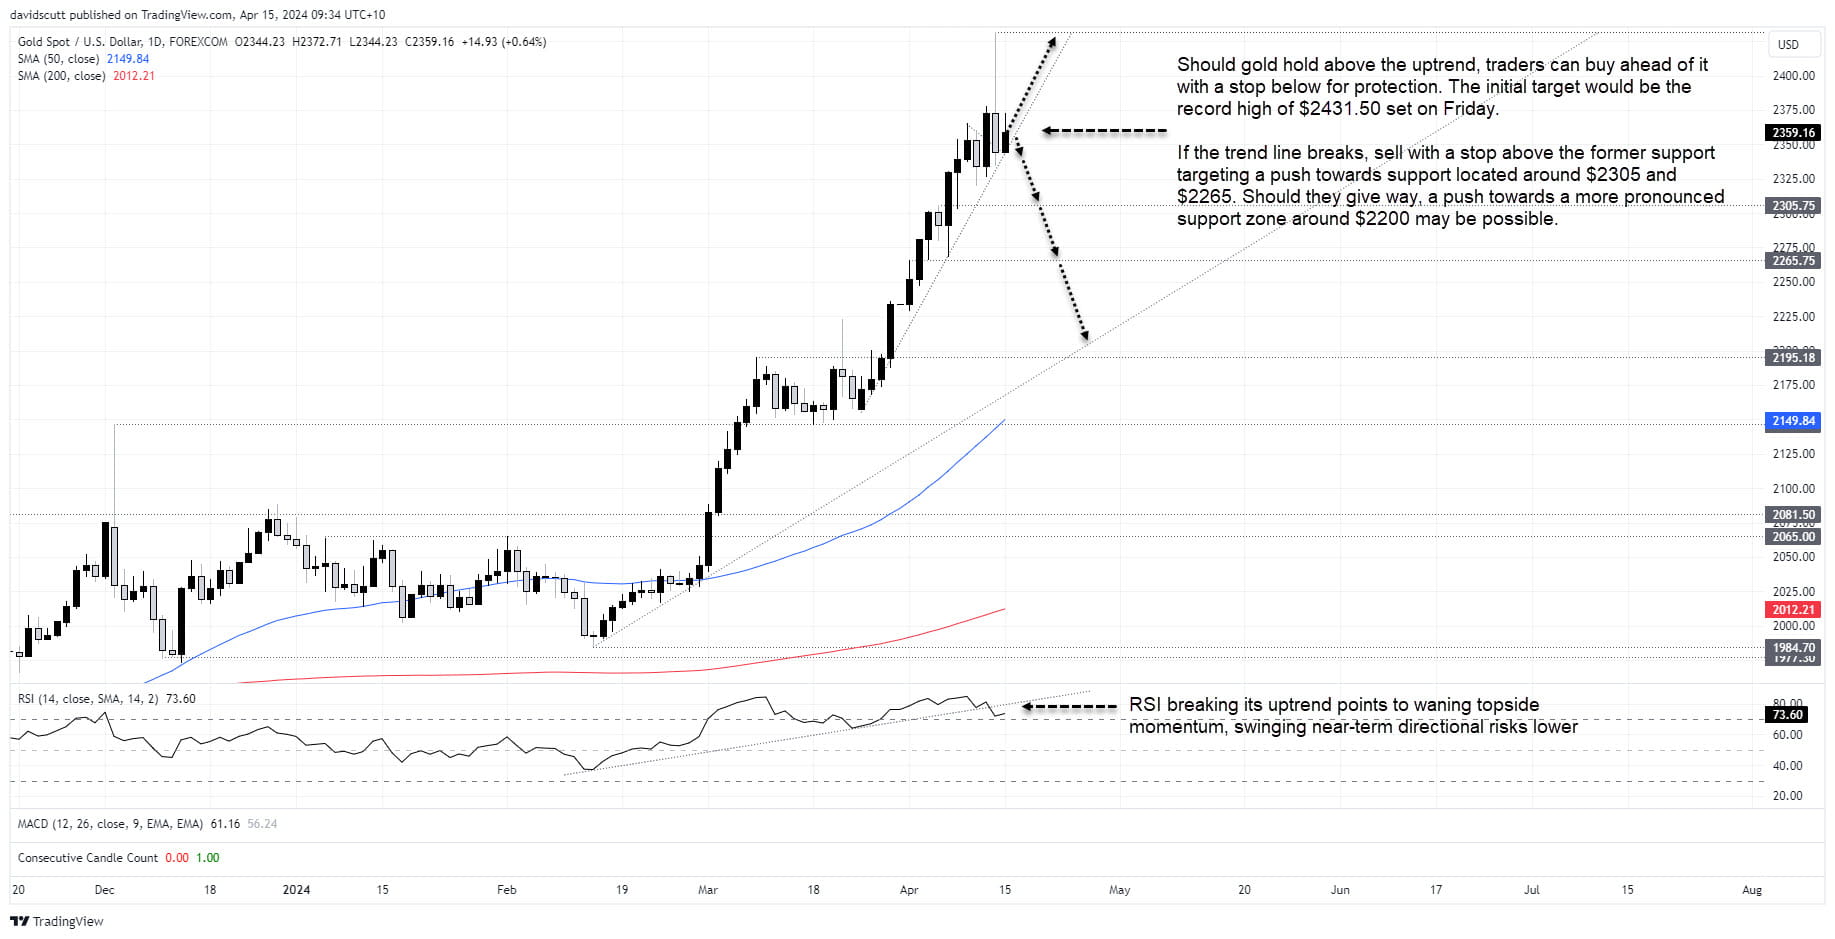
If the trendline were to give way – a clear and growing risk given the price action on Friday and waning bullish momentum – the trade above can be flipped around, allow for traders to sell the break with a stop above the former trendline for protection.
Minor resistance is found at $2305.75 and $2265.75, with a more pronounce support zone located just below $2200 given the proximity of horizontal support, uptrend support running from mid-February and the 50-day moving average.
Should a downside break occur, it should not be interpreted as anything more than a corrective move with the pullback likely to draw buyers from the sidelines in the absence of a big upward shift in the US interest rate outlook or an abrupt de-escalation in geopolitical tensions. Neither see likely near-term.
-- Written by David Scutt
Follow David on Twitter @scutty
How to trade with City Index
You can trade with City Index by following these four easy steps:
-
Open an account, or log in if you’re already a customer
• Open an account in the UK
• Open an account in Australia
• Open an account in Singapore
- Search for the market you want to trade in our award-winning platform
- Choose your position and size, and your stop and limit levels
- Place the trade
Latest market news
Yesterday 01:32 PM
Yesterday 09:35 AM
Yesterday 07:23 AM
Yesterday 04:48 AM
Yesterday 12:17 AM
July 25, 2024 10:39 PM
Latest Gold articles

July 22, 2024 02:47 AM

July 15, 2024 01:00 AM

July 9, 2024 02:32 AM

July 4, 2024 02:30 PM