

- Gold price looks toppy in the near-term
- Its inverse relationship with the USD and bond yields has broken down
- Inflation expectations and technicals look to be asserting themselves
The inverse relationship between bond yields and US dollar with the gold price has broken down in 2024, meaning technicals and inflation expectations are arguably a more important driver right now in terms of its near-term trajectory. With the price action looking toppy and inflation concerns as elevated as they’ve been since October 2023, upside for bullion may be hard won in the near-term.
Gold is not behaving as you’d expect right now
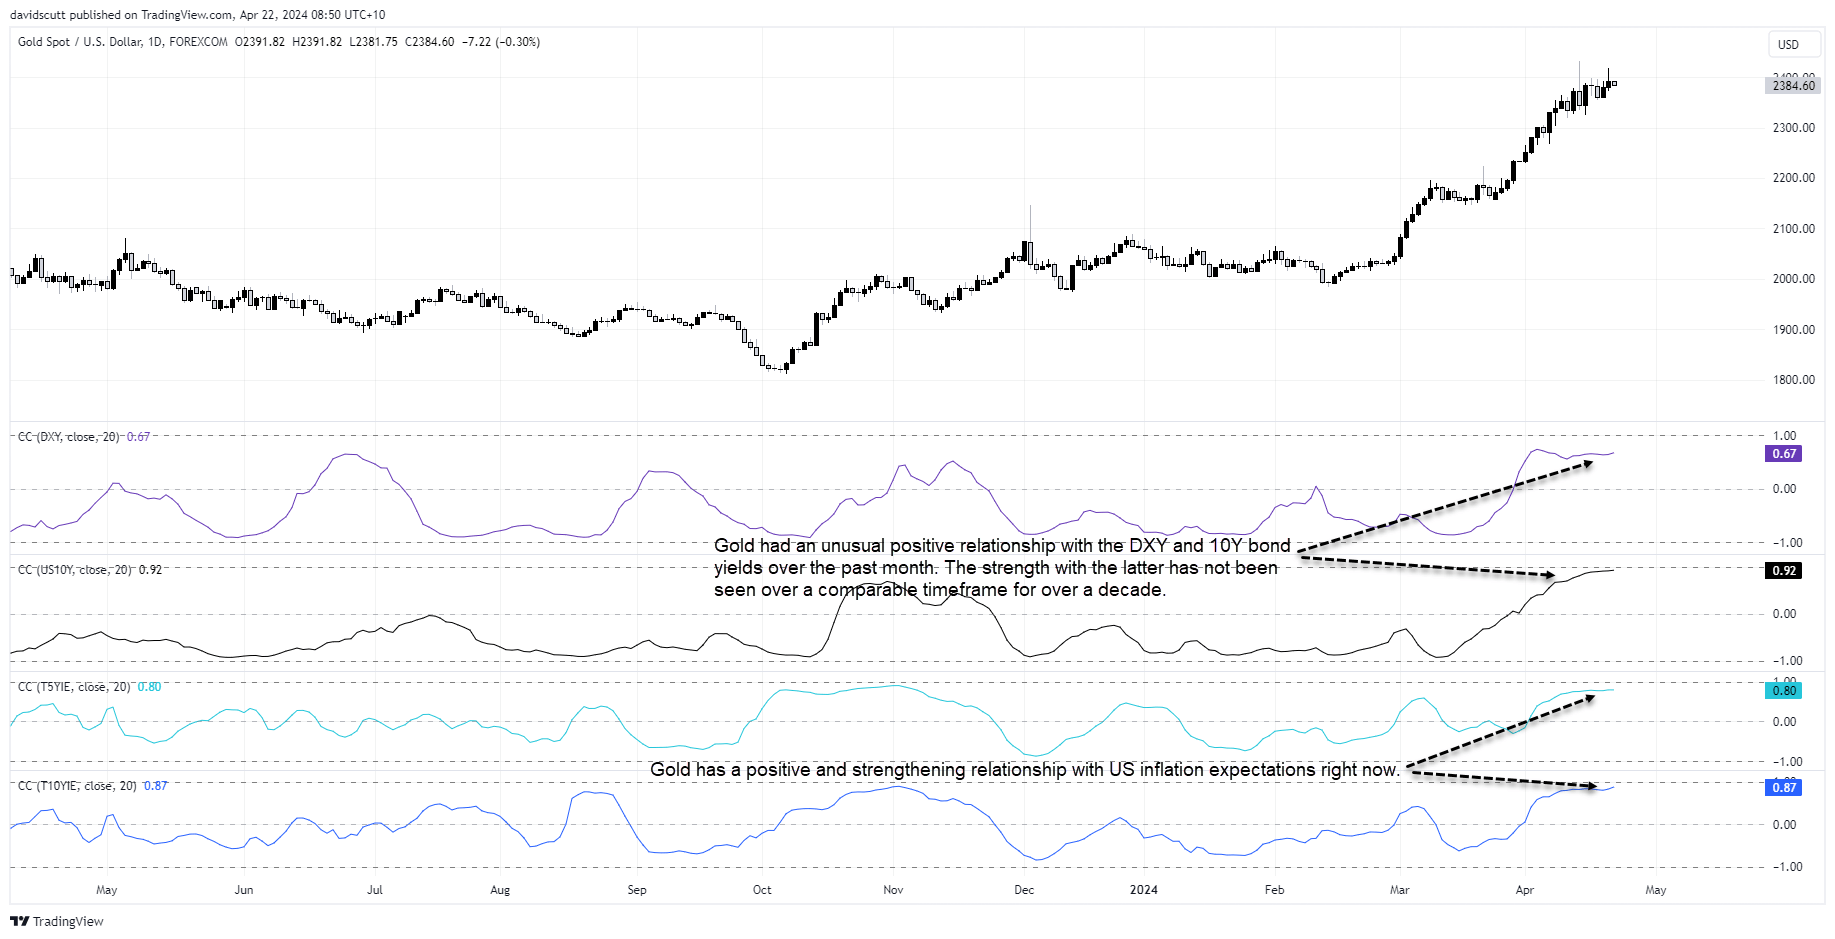
Rising bond yields and a stronger US dollar are usually a toxic mix for gold, creating headwinds from both a relative return and currency basis. But not this year. Rather, gold has been moving in the same direction as US dollar and benchmark 10-year bond US bond yields often over the past month, hitting record high after record high despite markets paring 2024 US rate cut expectations from seven to less than two in the space of four months.
The unusual positive relationship between gold and US dollar index and 10-year US bond yields is evident in the correlation coefficient analysis below with scores of 0.67 and 0.92 respectively over the past four weeks on a daily timeframe. The positive relationship with the latter is extremely unusual, sitting at levels not seen for well over a decade.
Essentially, even though nominal bond yields are offering increasingly juicy returns for one of the most popular safe haven assets globally, the rally in non-interest-bearing gold is showing no signs of slowing down.
Inflation hedge, technical breakout influencing performance
With traditional fundamental drivers breaking down, it suggests traders need to look elsewhere for clues as to what’s driving the gold price right now. One look at the strong, positive relationship gold has had with US five and 10-year inflation breakevens over the past 20 days suggests it’s role as an inflation hedge may be reasserting itself. Inflation breakevens measure the average inflation rate markets expect over a specific timeframe.
And while central bank buying, increased demand from China and Russia and heightened geopolitical tensions have contributed to gold’s upward bias, you shouldn’t discount the important role technical analysis looks to be playing right now.
As explained in a post earlier this month, gold is doing exactly what you’d expect after breaking cleanly though long-running horizontal resistance. While the longer-term trajectory still looks to be higher, in the near-term, the unconvincing price action last week suggests gold may need to move lower before it can extend its run higher. Every sustainable bull market needs to breathe, so a modest pullback should be regarded as a healthy development for bulls, should it occur.
Gold rally looks in need of a pullback
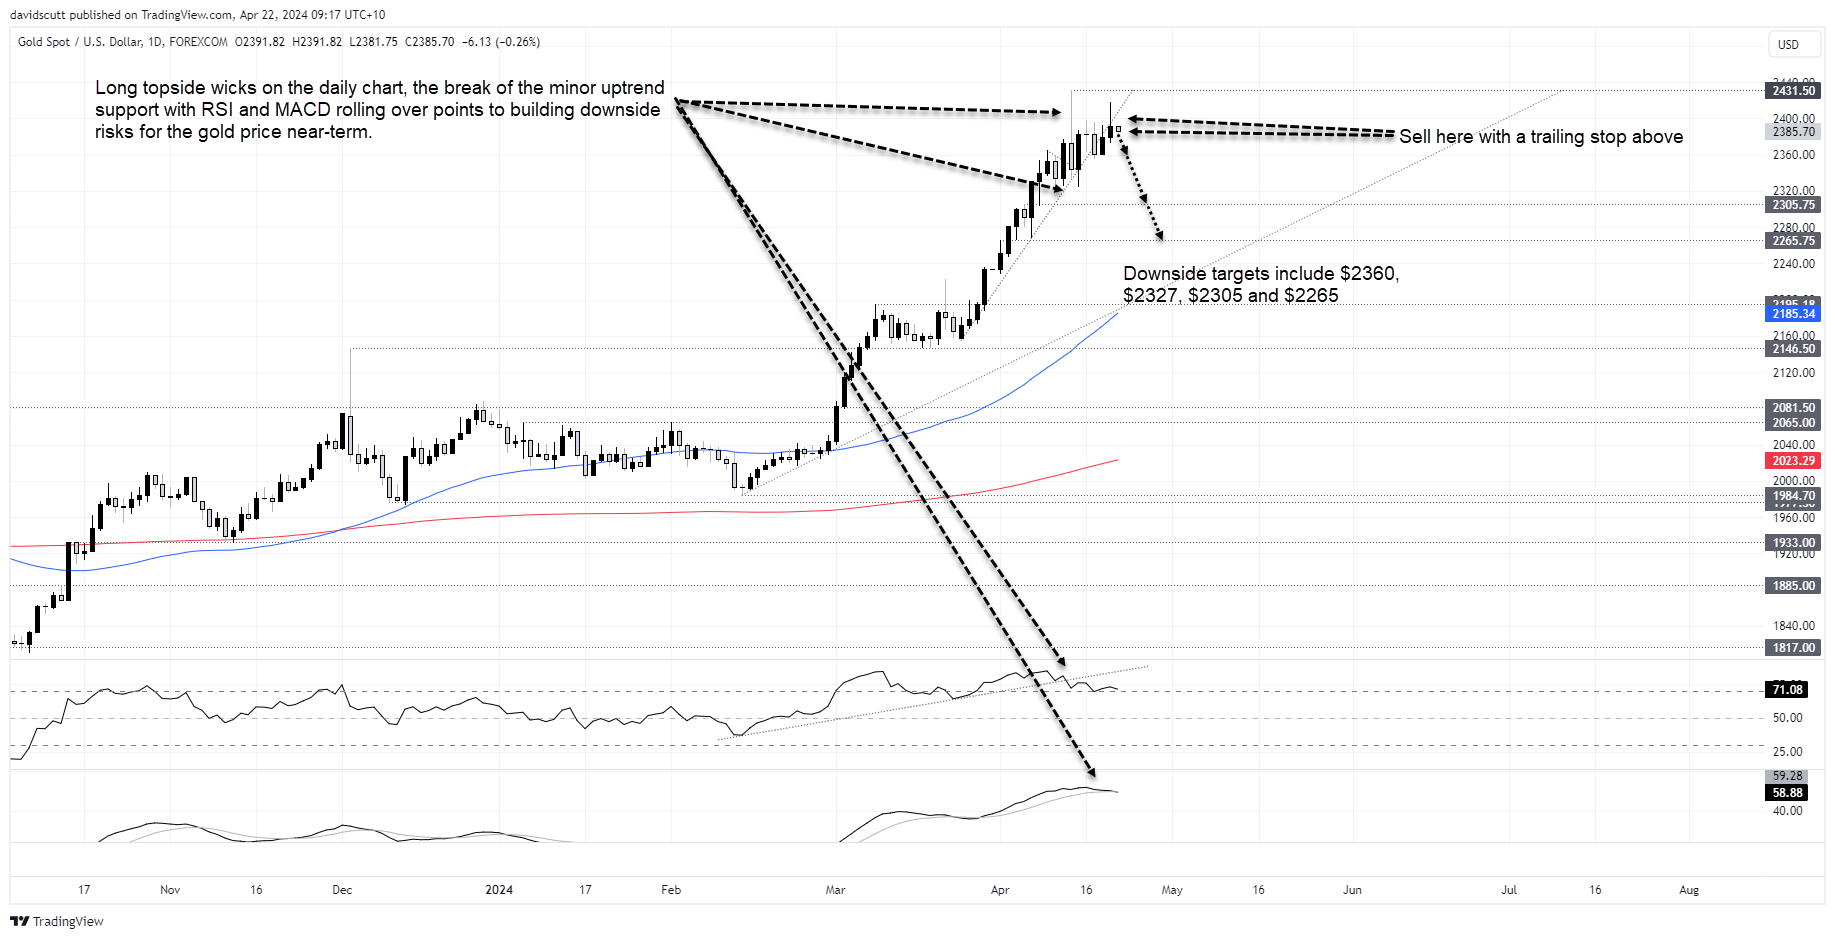
Looking at the daily, the long topside wicks either side of $2400 point to sellers gaining the ascendency, seeing the price break the minor uptrend it had been sitting in since mid-March on Friday. The inverted hammer to end the week adds to the sense of growing downside risks, contributing to RSI breaking its uptrend and MACD crossing over from above. Momentum is building to the downside.
Those considering taking the short trade on could sell around these levels with a trailing stop above, targeting a push towards a series of minor support levels located below. Initial targets include $2360, $2327, $2305 and $2265. Depending on which you target, make sure your stop level is set appropriately to provide acceptable risk-reward.
Risks to the short gold trade
Looking ahead, main risks to the trade would be an undeniable escalation in Middle Eastern tensions. On Friday, the Federal Reserve’s preferred underlying inflation measure, the core personal consumption expenditure (PCE) deflator, is the most obvious known risk event this week. While a softer number would likely lead to a weaker US dollar and lower US bond yields, as discussed above, that traditionally bullish outcome may not lead to upside on this occasion. Instead, should the data print hotter-than-expected, the flow-through to inflation expectations may actually help to boost bullion’s appeal.
-- Written by David Scutt
Follow David on Twitter @scutty
How to trade with City Index
You can trade with City Index by following these four easy steps:
-
Open an account, or log in if you’re already a customer
• Open an account in the UK
• Open an account in Australia
• Open an account in Singapore
- Search for the market you want to trade in our award-winning platform
- Choose your position and size, and your stop and limit levels
- Place the trade
Latest market news
Yesterday 01:32 PM
Yesterday 09:35 AM
Yesterday 07:23 AM
Yesterday 04:48 AM
Yesterday 12:17 AM
July 25, 2024 10:39 PM
Latest Gold articles

July 22, 2024 02:47 AM

July 15, 2024 01:00 AM

July 9, 2024 02:32 AM

July 4, 2024 02:30 PM