

- Gold outlook remains steady even as Iran downplays impact of Israel strikes
- Focus turns to sticky inflation and elevated interest rates narrative
- Gold technical analysis shows no signs of bearish reversal yet
Defying gravity, gold’s abnormal price action continues. It has decoupled from the US dollar completely, and from the bond markets, with yields rising alongside gold, which hardly ever happens. Clearly, haven flows and central bank buying are bigger considerations for traders than the continued ascend of bond yields, which in theory should be increasing the opportunity cost of holding non-interest-bearing assets. For example, the US 2-year is almost providing a 5% nominal yield right now. By keeping their capital tied in gold, investors are foregoing this “risk free” return in government bonds. At some stage, the continued ascend in yields should weigh on gold, for as long as investors don’t see a risk of the US defaulting. Perhaps it is the ongoing uncertainty concerning the Middle East, which is playing an even bigger role in gold’s resiliency.
Gold outlook remains steady even as Iran downplays impact of Israel strikes
Overnight, risk assets dipped due to reports of Israeli strikes in western Iran, sparking a rally in gold and crude oil. Market sensitivity to the Middle East tensions was evident. Indices recovered from their overnight lows sharply during the bulk of the European session, but gold and crude oil also bounced off their lows. Stock market investors seemed to have downplayed the impact of the small-scale strike, suggesting that deterrence is restored, and an open conflict can be averted. Nonetheless, with looming weekend risk and recent attacks, caution prevails. This may explain why gold was holding steady at the time of writing late in the day here in the European session.
Focus turns to sticky inflation and elevated interest rates narrative
As mentioned, gold investors have hardly responded to rising bond yields. Perhaps they are holding gold to hedge against inflation as fiat currencies continue to lose value. Federal Reserve Chairman Jerome Powell has cautioned that a robust US economy might justify keeping rates at their current levels for an extended period as necessary, emphasising that inflation had exhibited a "lack of progress" towards their objectives. This puts next week’s Core PCE inflation data into a sharp focus.
After a strong US CPI print, the dollar has been pushing higher, especially considering that both US interest rates and those of other major economies, such as the ECB and the Bank of Canada, have recently taken a more favourable turn for the greenback. Additionally, the escalation of geopolitical risks in the Middle East has only added to the US dollar’s overall bullish tone. If Core PCE also turns out to be stronger, then this could keep the dollar supported and potentially undermine risk assets. But the question remains: will gold finally buckle under pressure from the US dollar?
Gold outlook: Technical levels and factors to watch
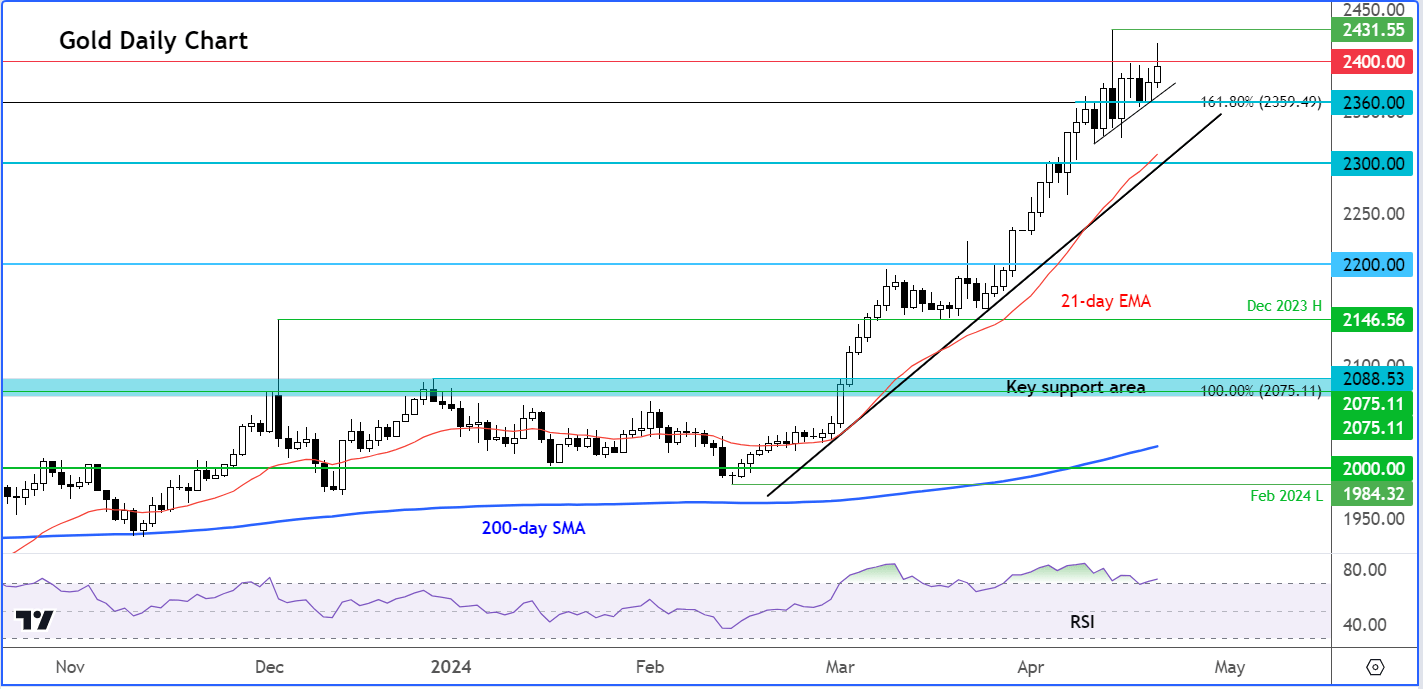
Source: TradingView.com
Gold has been continuing to consolidate its recent sharp gains for the last week and a bit. So far, the gold chart has not been able to post a daily close above the $2400 level, which is providing some resistance against this strong bullish trend. Apart from the big, inverted hammer candle last Friday, we haven’t seen many bearish signals yet. In normal circumstances, that type of a candle would point to a possible near-term top. However, gold’s price action has been far from normal. It has decoupled from the US dollar completely, and from the bond markets, with yields rising alongside gold, which hardly ever happens. The sellers are lacking conviction at this stage. What we will need to see from a bearish point of view, is the breakdown of some key short term support levels to start at least a short-term bearish trend.
The first level of support to watch is at around $2360, which is also the 161.8% Fibonacci extension level of a major price swing from 2020 high to 2022 low. In fact, this is where I was previously expecting gold to potentially top out around. At the moment, price is holding above this Fibonacci extension level, but should it go below it then that could put the late buyers of gold under some pressure.
Still, with lots of former resistance levels on the way down, any potential selling pressure could be limited. At this stage I am merely eyeing a possible pullback to the rising trendline seen at around $2300. Thereafter we have a few more important support levels way lower near the $2200 area. But we'll cross that bridge if and when we get there.
On the upside, the next level of potential resistance is last week's high at $2431, which was also a record high. As gold is trading near its record highs, we don’t have any other prior reference points beyond this high to monitor.

-- Written by Fawad Razaqzada, Market Analyst
Follow Fawad on Twitter @Trader_F_R
How to trade with City Index
You can trade with City Index by following these four easy steps:
-
Open an account, or log in if you’re already a customer
• Open an account in the UK
• Open an account in Australia
• Open an account in Singapore
- Search for the company you want to trade in our award-winning platform
- Choose your position and size, and your stop and limit levels
- Place the trade
Latest market news
Yesterday 01:32 PM
Yesterday 09:35 AM
Yesterday 07:23 AM
Yesterday 04:48 AM
Yesterday 12:17 AM
July 25, 2024 10:39 PM
Latest Gold articles

July 22, 2024 02:47 AM

July 15, 2024 01:00 AM

July 9, 2024 02:32 AM

July 4, 2024 02:30 PM