April 8, 2021 5:03 PM
Gold and DXY "ARE" negatively correlated
Gold bugs are on the edge of their chairs as the precious metal trades to horizontal resistance and the US Dollar Index is near 92.00. The two assets have an odd relationship. Many people say that Gold and the US Dollar have an inverse relationship. That is, when one asset moves higher, the other one moves lower. While that may generally be true, there are various intensities to that relationship.
Learn how to start gold trading!
XAU/USD is trading at its highest level in a month and a half, near 1755. On February 26th, Gold broke below its November 30th lows and fell to the bottom trendline of a downward sloping channel it had been in since August 2020, near 1676.90. Gold then bounced for the first half of March and sold off again at the end of the month. Price tested the previous March lows but failed to break below. As the price of XAU/USD moved higher in early April, two setups were formed: 1) price broke above the downward sloping trendline of a descending wedge dating back to January 6th 2) with today's move to a high of 1758.74, it set up a double bottom breakout. Notice how the RSI diverged from price between the first low and the second low, indicating that price may have been ready for a bounce.
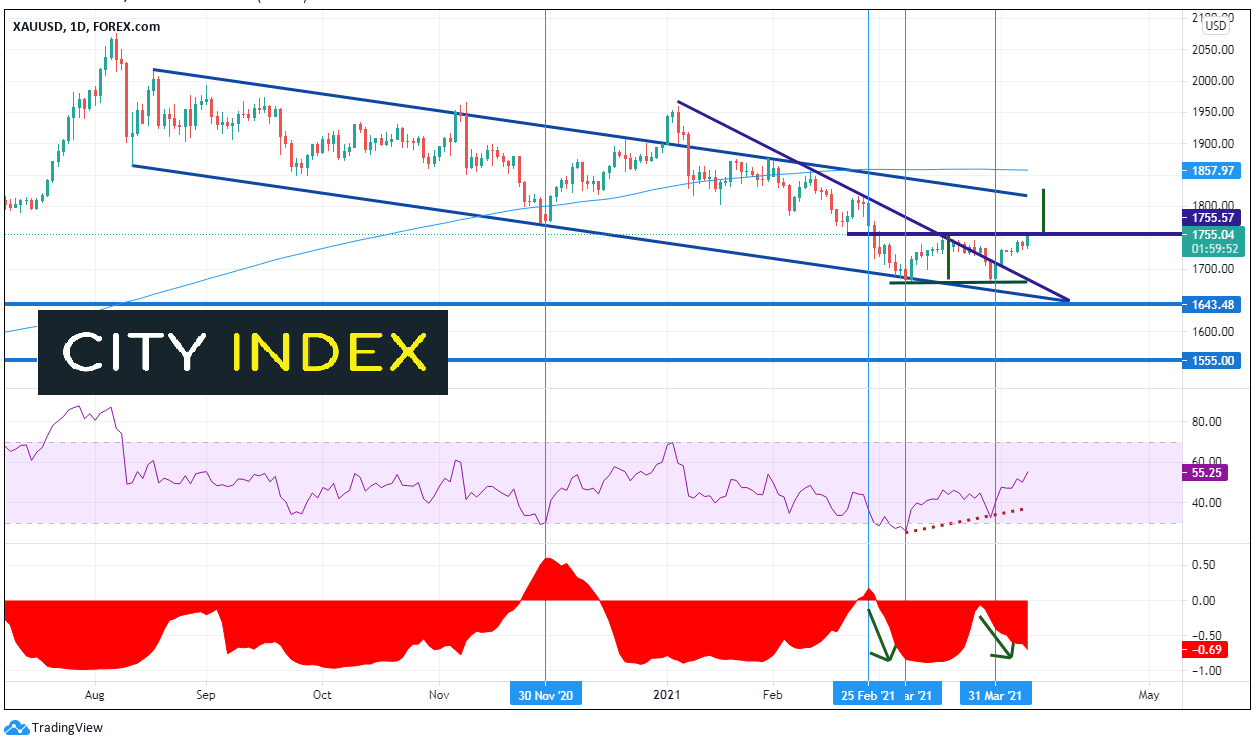
Source: Tradingview, City Index
On the bottom of the chart is the correlation coefficient between Gold and the US Dollar. Notice how over time, the correlation coefficient is negative, however to various degrees. When Gold put in a low on November 30th, the 2 assets were briefly positively correlated, meaning DXY and Gold moved together! As price moved lower on February 25th, the correlation coefficient moved from positive territory to negative, and was at -0.89 when Gold put in a low on March 8th. Afterwards, the relationship remained negative, however at lesser degrees. When Gold bounced off the prior low on March 31st, the correlation was moving lower once again and was near -0.40. It continued lower through today, to near -0.69. The negative correlation appears to be gaining strength. Therefore, right now, it seems that if the DXY continues to move lower, XAU/USD should move higher. To put this into practice, if the DXY moves below 92.00, XAU/USD should move above 1758.74.
The target price for a double bottom pattern is the height of the pattern added to the breakout point, which in this case is near 1827. The first resistance level is the long term, top, downward sloping trendline of the channel, near 1808. If price reaches target, the next resistance level is the 200 Day Moving Average near 1858. First support is today’s lows at 1733.22. Below there is the intersection of the lows from the double bottom and the bottom, downward sloping trendline of the wedge, near 1678. Long term horizontal support (dating back to March 2020) sits below there at 1643.5.
Gold is sitting near 1755 and the DXY is sitting near 92.00. Although XAU/USD and DXY are not always negatively correlated to the same degree, they are negatively correlated most of the time. With the current correlation at -0.69, if one asset breaks and closes through its support or resistance level, the chances are nearly 70% that the other one will break through as well!
Learn more about gold and silver trading opportunities
Latest market news
Yesterday 01:32 PM
Yesterday 09:35 AM
Yesterday 07:23 AM
Yesterday 04:48 AM
Yesterday 12:17 AM
July 25, 2024 10:39 PM
Latest DXY articles

July 22, 2024 09:30 AM

July 17, 2024 11:18 PM

July 15, 2024 11:20 PM

July 12, 2024 10:38 AM