

Asian Indices:
- Australia's ASX 200 index fell by -4.5 points (-0.06%) and currently trades at 7,073.70
- Japan's Nikkei 225 index has risen by 97.87 points (0.29%) and currently trades at 33,452.01
- Hong Kong's Hang Seng index has fallen by -13.71 points (-0.08%) and currently trades at 17,720.18
- China's A50 Index has fallen by -50.45 points (-0.42%) and currently trades at 11,989.13
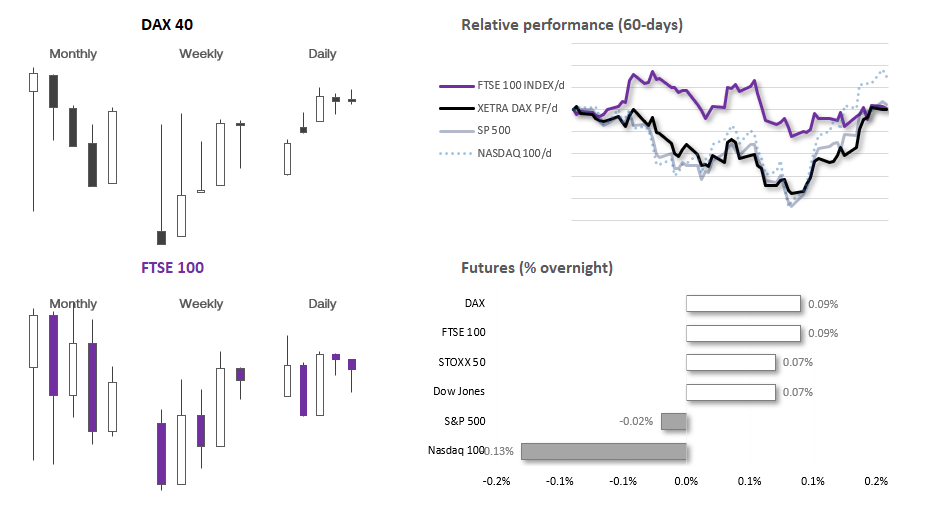
UK and European indices:
- UK's FTSE 100 futures are currently up 6.5 points (0.09%), the cash market is currently estimated to open at 7,488.49
- Euro STOXX 50 futures are currently up 3 points (0.07%), the cash market is currently estimated to open at 4,334.90
- Germany's DAX futures are currently up 15 points (0.09%), the cash market is currently estimated to open at 15,915.53
US index futures:
- DJI futures are currently up 23 points (0.07%)
- S&P 500 futures are currently down -1 points (-0.02%)
- Nasdaq 100 futures are currently down -20.5 points (-0.13%)
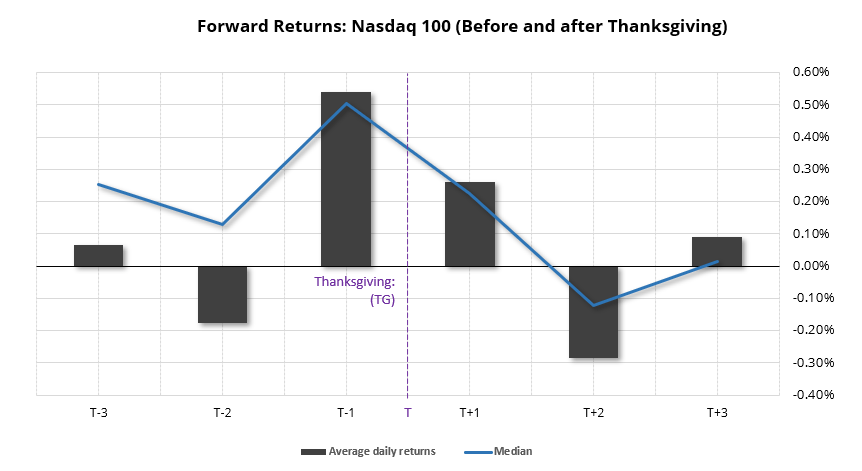
Earlier this week I looked at how the Nasdaq has historically performed the three days either side of Thanksgiving, which lands on a Thursday and US equity markets are closed. And it is interest to note that Monday produced an up day and Tuesday a down day, in line with its historical tendency. And as the Wednesday prior to Thanksgiving has produced the strongest average and median returns alongside an impressive 80.6% win rate, I’m keen to see if this high probability up day materialises today on the Nasdaq 100. Also note that the following Friday has historically produced the second best average and median returns, along with the second highest win rate of 58.3%. So let us take a look at the charts.
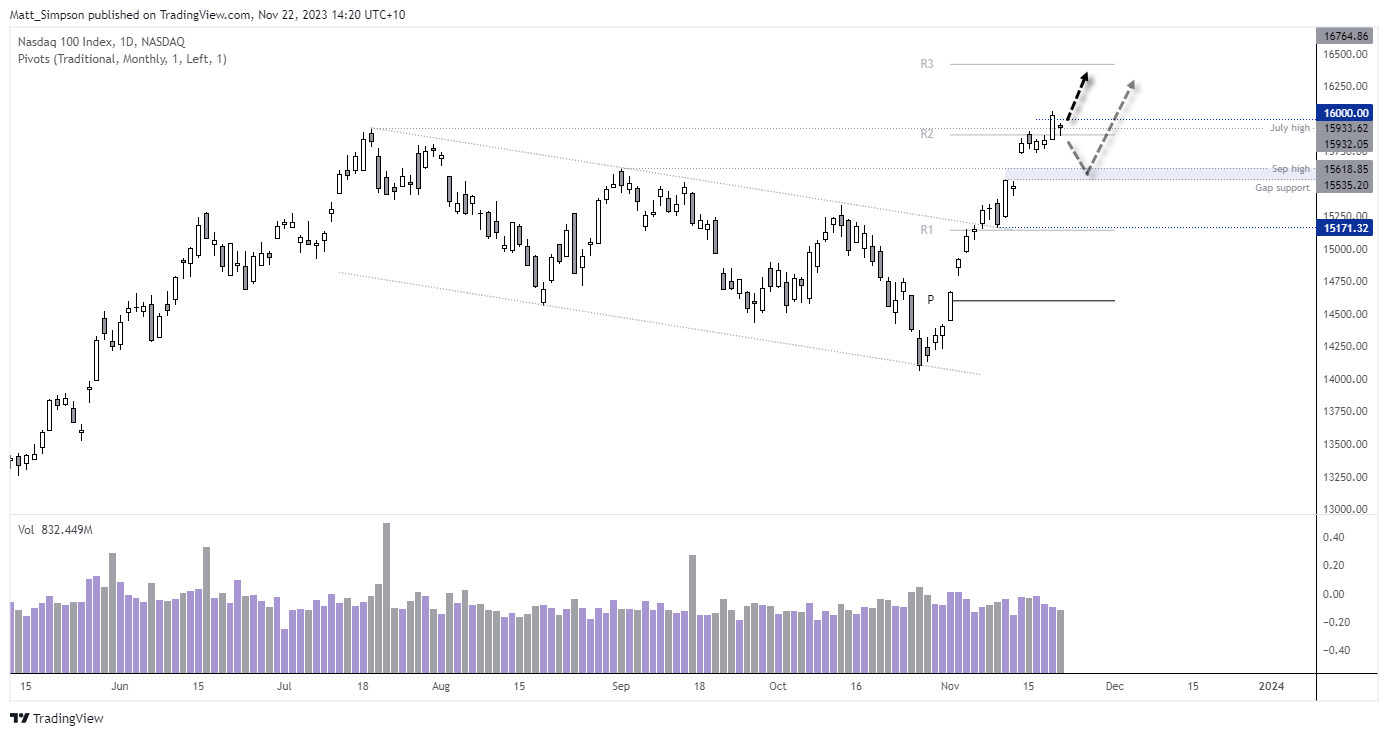
Nasdaq 100 technical analysis (daily chart):
The daily chart shows a strong bullish trend, although there has been a slight hesitancy to hold above 16,000. A small inside day formed on Tuesday, although it found support at the monthly R2 pivot point and closed on the July high – which also shows a hesitancy to fall immediately.
Should prices retrace further on the daily chart, bears could either target the gal low or September high around 15,600.
Nasdaq 100 technical analysis (daily chart):
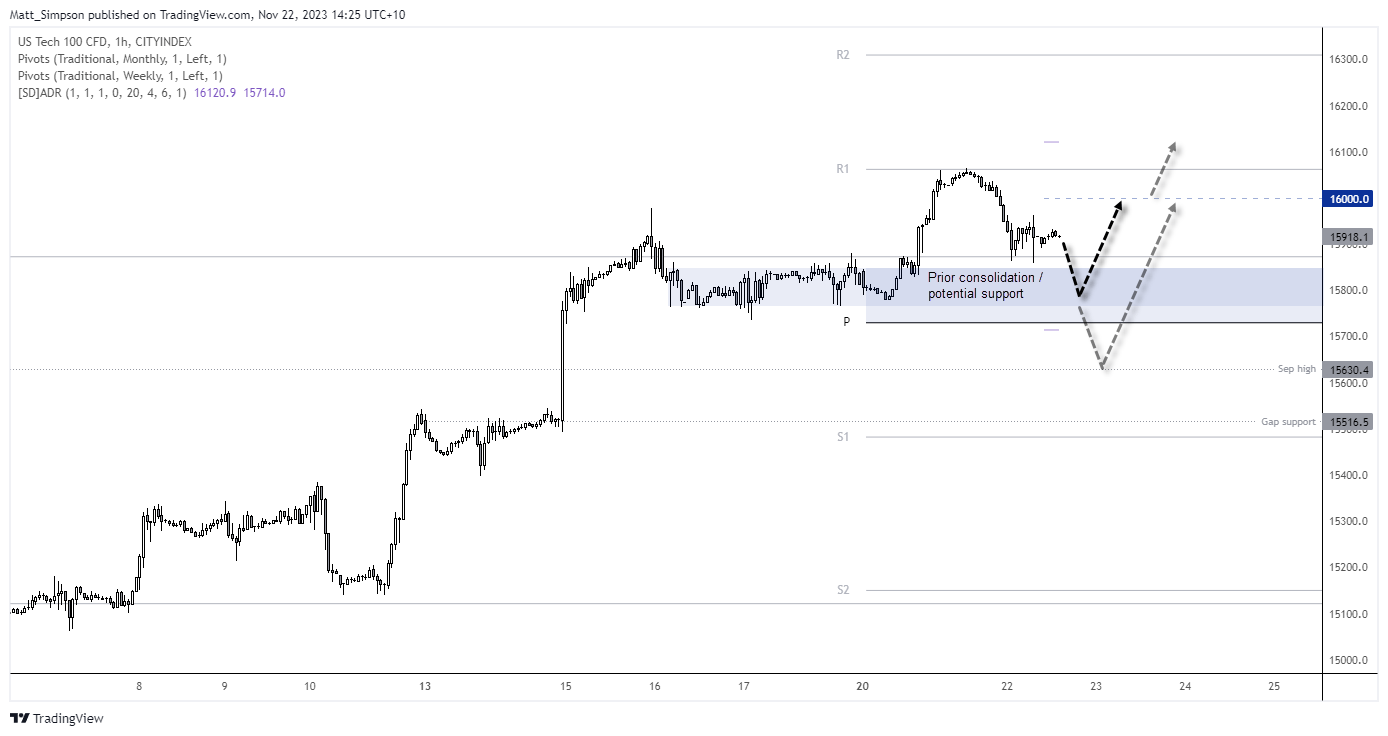
With an 80% win rate on Wednesday’s prior to Thanksgiving, I feel inclined to have a bullish bias on the Nasdaq today – even though it has recently hit a cycle high as of Monday. However, I’m always a bit of a sceptic on intraday charts and expect a false move in the opposite direction of its intended move, more often than not.
Therefore, I am seeking an initial move back within the prior consolidation area as such zones can provide decent areas of support or resistance. Also note that the consolidation is just above the weekly pivot point. Bulls could seek evidence of a swing low within the zone in anticipation of a move to 16,000, but take note that the historical average daily range band suggests the highs could be closer to 6100 is all goes well.
With US markets closed on Thursday, traders may need to ask themselves if they wish to hold over Thursday at the risk of a mid-week gap.
Events in focus (GMT):
- No major economic data is scheduled today’s Asia session
- 08:35 – Speech by Michele Bullock, RBA Governor – A Monetary Policy Fit for the Future – at the ABE Annual Dinner, Sydney. The Governor will talk about the recent monetary policy decision and progress on the implementation of recommendations of the Review of the Bank.
- 09:00 – BOE and ECB financial stability reports
- 10:00 – UK HM Treasury Autumn forecast statement (mini budget)
- 11:00 – UK industrial trends orders (CBI)
- 12:00 – US mortgage data
- 12:30 – German import price index
- 13:30 – US jobless claims data, durable goods orders
- 13:30 – Canada manufacturing and wholesale sales
- 14:10 – ECB’s Elderson speaks
- 15:00 – US consumer sentiment and CPI expectations (University of Michigan)
- 15:00 – Euro consumer confidence
- 15:30 – Crude oil inventories
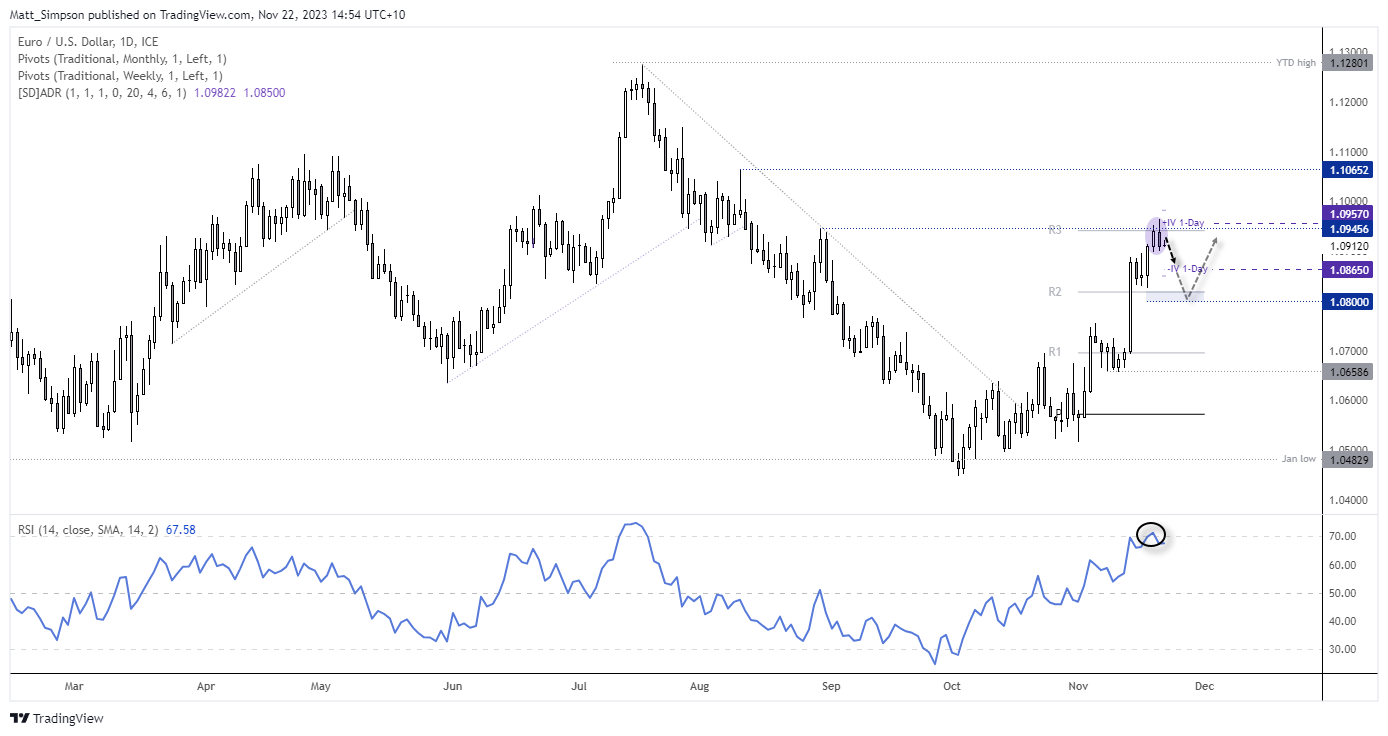
EUR/USD technical analysis (daily chart):
The euro has not only produced a solid run since its late-September low, but its bullish momentum has also increased in the second half of the rally. I suspect there is more upside to come on the euro (or more weakness on the US dollar, to be more precise) but EUR/USD may be in need of a pullback. A 2-bar bearish reversal formed around the August 30 high and RSI (14) reached overbought.
Monday’s close and Tuesday’s open were both below the monthly R3 pivot and both accompanied with false break above it. Therefore, today’s bias is bearish beneath the monthly R3 and for a move towards 1.0865 – near the lower 1-day implied volatility band.
View the full economic calendar
-- Written by Matt Simpson
Follow Matt on Twitter @cLeverEdge
How to trade with City Index
You can trade with City Index by following these four easy steps:
-
Open an account, or log in if you’re already a customer
• Open an account in the UK
• Open an account in Australia
• Open an account in Singapore
- Search for the market you want to trade in our award-winning platform
- Choose your position and size, and your stop and limit levels
- Place the trade
Latest market news
Yesterday 01:32 PM
Yesterday 09:35 AM
Yesterday 07:23 AM
Yesterday 04:48 AM
Yesterday 12:17 AM
July 25, 2024 10:39 PM
Latest Trade Ideas articles

Yesterday 09:35 AM

Yesterday 12:17 AM

July 25, 2024 10:39 PM

July 25, 2024 05:30 PM