

Asian Indices:
- Australia's ASX 200 index rose by 37.4 points (0.5%) and currently trades at 7,556.60
- Japan's Nikkei 225 index has fallen by -3.53 points (-0.01%) and currently trades at 36,222.95
- Hong Kong's Hang Seng index has risen by 223.03 points (1.4%) and currently trades at 16,122.90
- China's A50 Index has risen by 119.45 points (1.08%) and currently trades at 11,229.60
UK and European indices:
- UK's FTSE 100 futures are currently down -26 points (-0.35%), the cash market is currently estimated to open at 7,501.67
- Euro STOXX 50 futures are currently down -6 points (-0.13%), the cash market is currently estimated to open at 4,558.11
- Germany's DAX futures are currently down -40 points (-0.24%), the cash market is currently estimated to open at 16,849.92
US index futures:
- DJI futures are currently up 75 points (0.2%)
- S&P 500 futures are currently up 0.75 points (0.02%)
- Nasdaq 100 futures are currently down -4.75 points (-0.03%)

Events in focus (GMT):
- 09:00 – German Ifo business sentiment
- 13:15 – ECB interest rate decision
- 13:30 – Canadian average earnings
- 13:30 – US GDP, jobless claims, durable goods orders, Chicago Fed national activity index
- 13:45 – ECB press conference
- 15:15 – ECB President Lagarde speaks
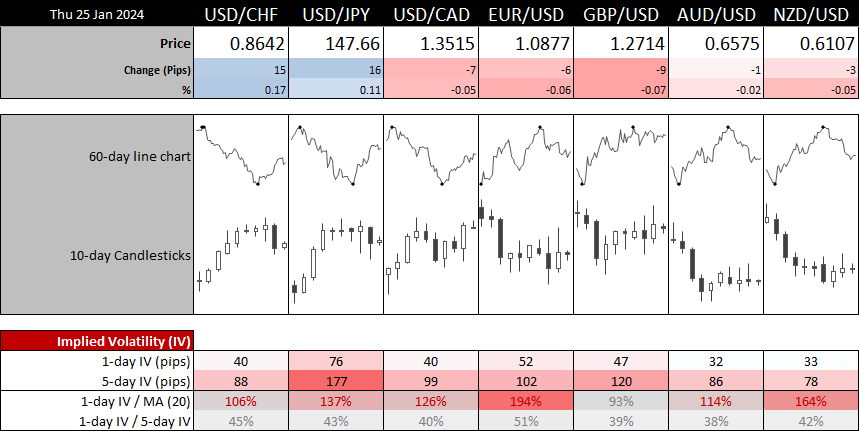
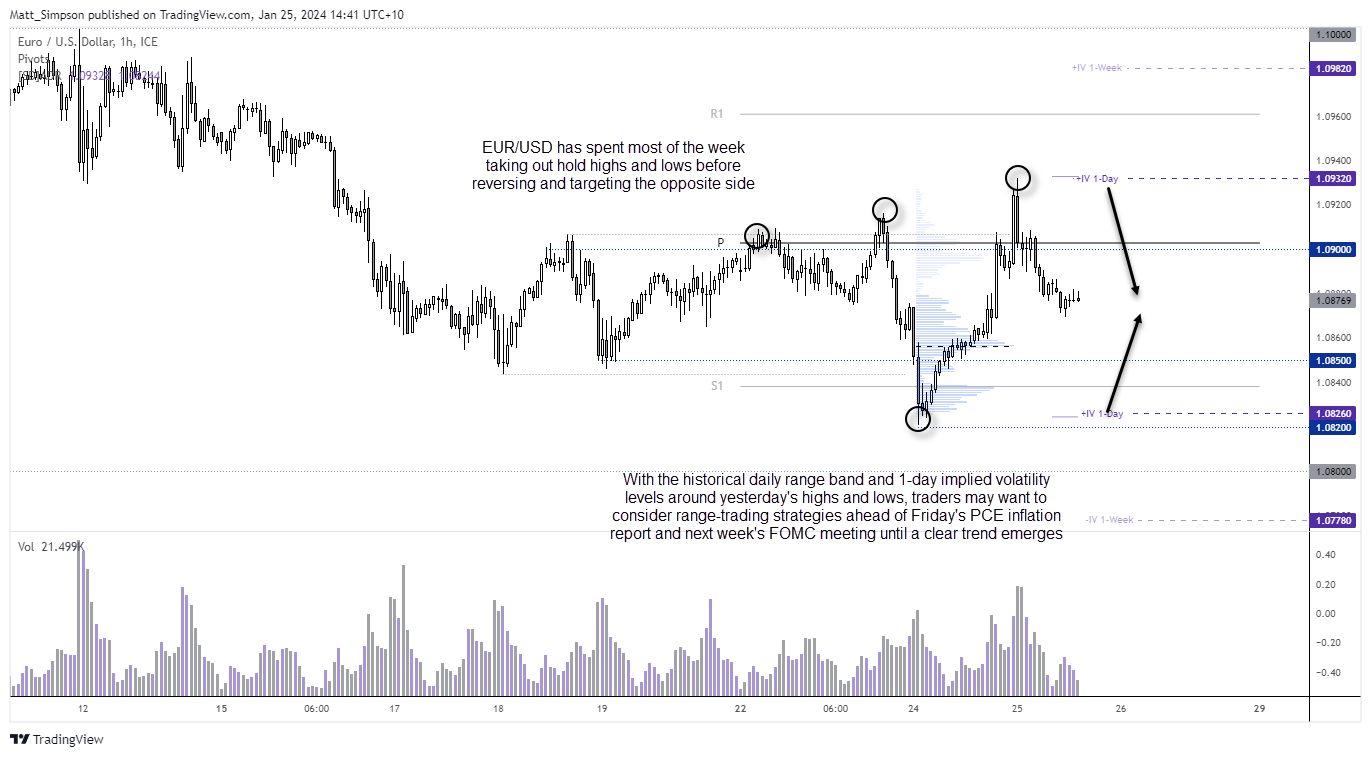
EUR/USD technical analysis (1-hour chart):
The 1-hour chart for EUR/USD is a sight for sore eyes. It lacks a defined trend and has seen bursts of volatility in both directions before reverting to the centre of its sideways chopfest. Whilst this is now what I typically like to see, I can make some sense of the carnage. We have an ECB meeting in a few hours, with US GDP also up for grabs and of course PCE inflation tomorrow. And that means we seem to be in a ‘seek and destroy’ week, where sudden market moves aim to seek pockets of liquidity out of a trading range before heading for the opposite side.
This is by no means a pleasant trading condition to be in, but it is what it is. That means traders can decide to step aside and wait until a clearer picture emerges or seek bullish reversals around swing lows of bearish ones around swing highs.
Note that the 1-day implied volatility band actually sits in line with the 1-day historical ATR band, which roughly ranges between 1.0825 – 1.0930. Which is in line with yesterday’s high and low.
View the full economic calendar
-- Written by Matt Simpson
Follow Matt on Twitter @cLeverEdge
How to trade with City Index
You can trade with City Index by following these four easy steps:
-
Open an account, or log in if you’re already a customer
• Open an account in the UK
• Open an account in Australia
• Open an account in Singapore
- Search for the market you want to trade in our award-winning platform
- Choose your position and size, and your stop and limit levels
- Place the trade
Latest market news
Yesterday 01:32 PM
Yesterday 09:35 AM
Yesterday 07:23 AM
Yesterday 04:48 AM
Yesterday 12:17 AM
July 25, 2024 10:39 PM
Latest Trade Ideas articles

Yesterday 09:35 AM

Yesterday 12:17 AM

July 25, 2024 10:39 PM

July 25, 2024 05:30 PM