

The bond rout and sharp rise in yields continues to take centre stage for sentiment. The combination of ‘higher for longer’ Fed rates and renewed concerns over a government shutdown has seen the long end of the curve continue higher this week. And where the long-end goes, the short-end tends to follow. And the longer this trend persists, the greater the odds appear for indices to finally roll over.
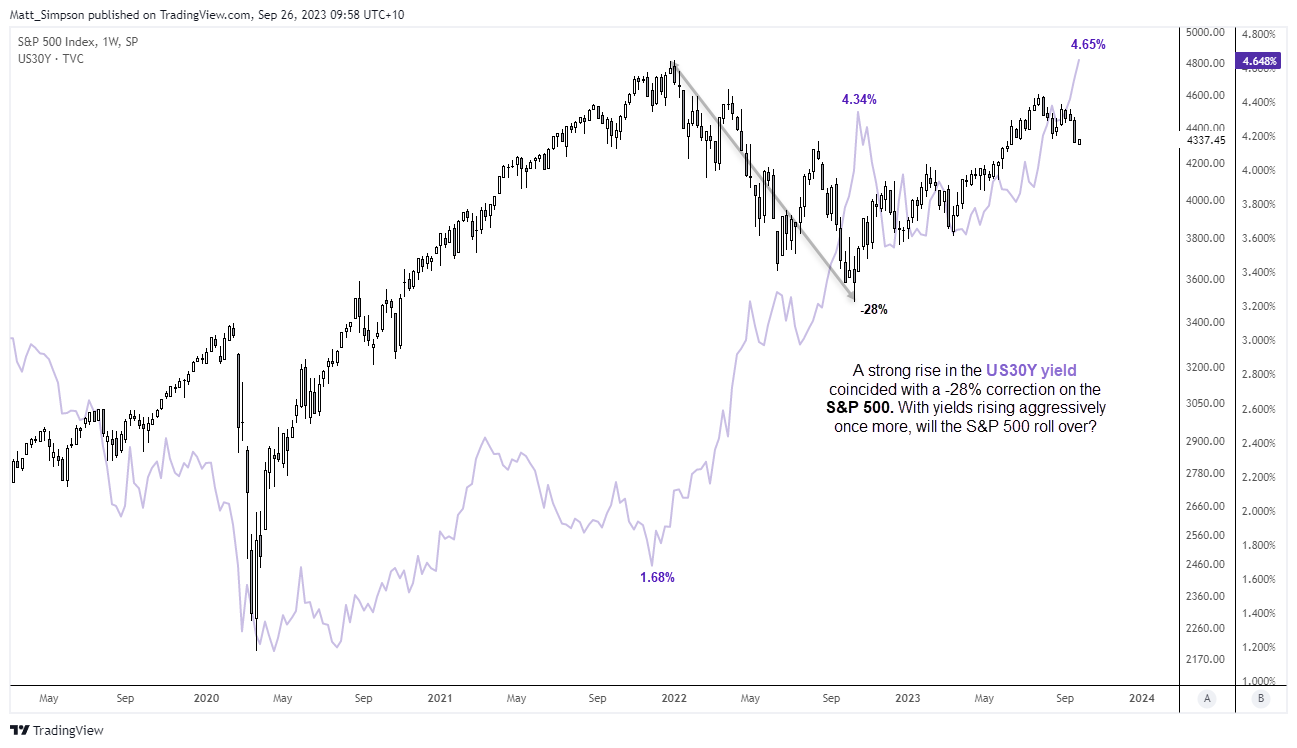
Correlations ebb and flow, and the relationship between bonds, yields, and the stock market is complex. But there are times when a strong rise in bond yields can coincide with a lower stock market. If we compare the US 30-year yield to the S&P 500, we can see that its rally from 1.68% in November 2021 occurred just ahead of the S&P 500's all-time high. The 30-year yield rose to 4.34% by October before pulling back, and its high marked the S&P 500's low. And with US yields rising again, the S&P 500 has been remarkably resilient.
Given three key US indices are showing minor signs of stability around their respective support levels, it brings with it the potential for a minor bounce over the near-term. But if bond yields keep rising as they have done recently, any such bounce could see bulls become liquidity for a bear feast.
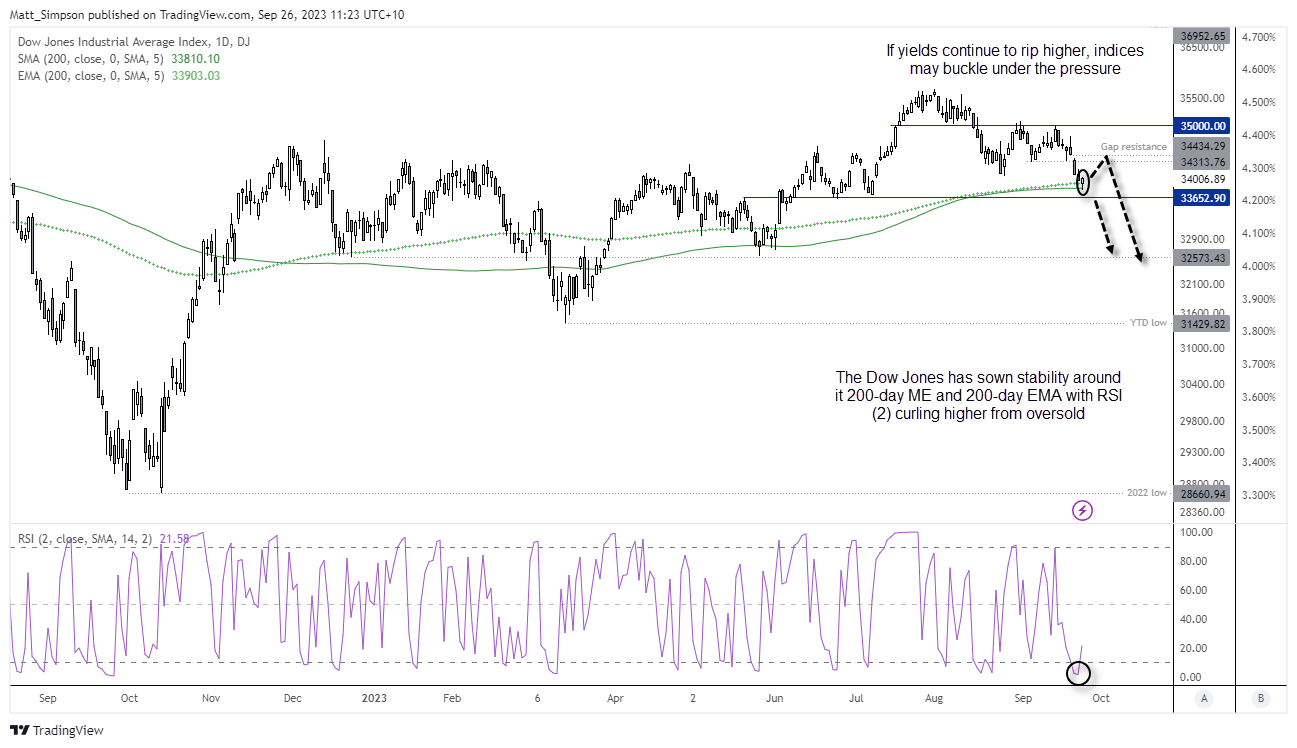
Dow Jones Industrial technical analysis (daily chart):
The Dow Jones fell to an 11-week low on Monday but managed to recoup its earlier losses and post a minor gain by the close. Its small bullish candle may look insignificant in isolation but, when you consider its lower wick found support at the 200-day MA and closed back above the 200-day EMA, it shows the Dow is not yet ready to completely roll over just yet. Furthermore, the RSI (2) was oversold on Friday and is now curling higher which warns of a near-term inflection point, and the market is holding above the pivotal level of 33,650.
Should yields continue to soar, it seems more likely that indices such as the Dow Jones will finally roll over with strong bearish momentum. But with the market holding above key averages, a bounce does not seem impossible over the near-term.
- Bulls could either seek a break of yesterday’s high and maintain a bullish bias whilst prices remain above Friday’s low, and seek a move to the 31,400 area on the assumption the Dow wants to close a gap.
- Alternatively, bears could wait for prices to show evidence of a wing high around the gap, and maintain a bearish bias whilst price remain beneath 35,000 and anticipate a break beneath 33,650
- Or bears could simply wait for a break beneath 35,650 And target lower swing lows (this also assumed that yields are continuing to rally)
Nasdaq 100 technical analysis (daily chart):
Of the three major Wall Street indices, the Nasdaq 100 is the only one not to have broken beneath its August low. This observation could be used to select the Nasdaq for bullish setups, or revert to the Dow Jones or S&P 500 for bearish setups.
The Nasdaq broke a bullish trendline last Tuesday after a high-volume down day, then on Wednesday a bearish engulfing candle formed, followed by a gap lower on Thursday. Whilst price action points lower, I must admit that the daily trading volumes aren’t overly aggressive. The Nasdaq is also holding above its August low with RSI (2) curling higher from its oversold level, to warn of a near-term inflection point.
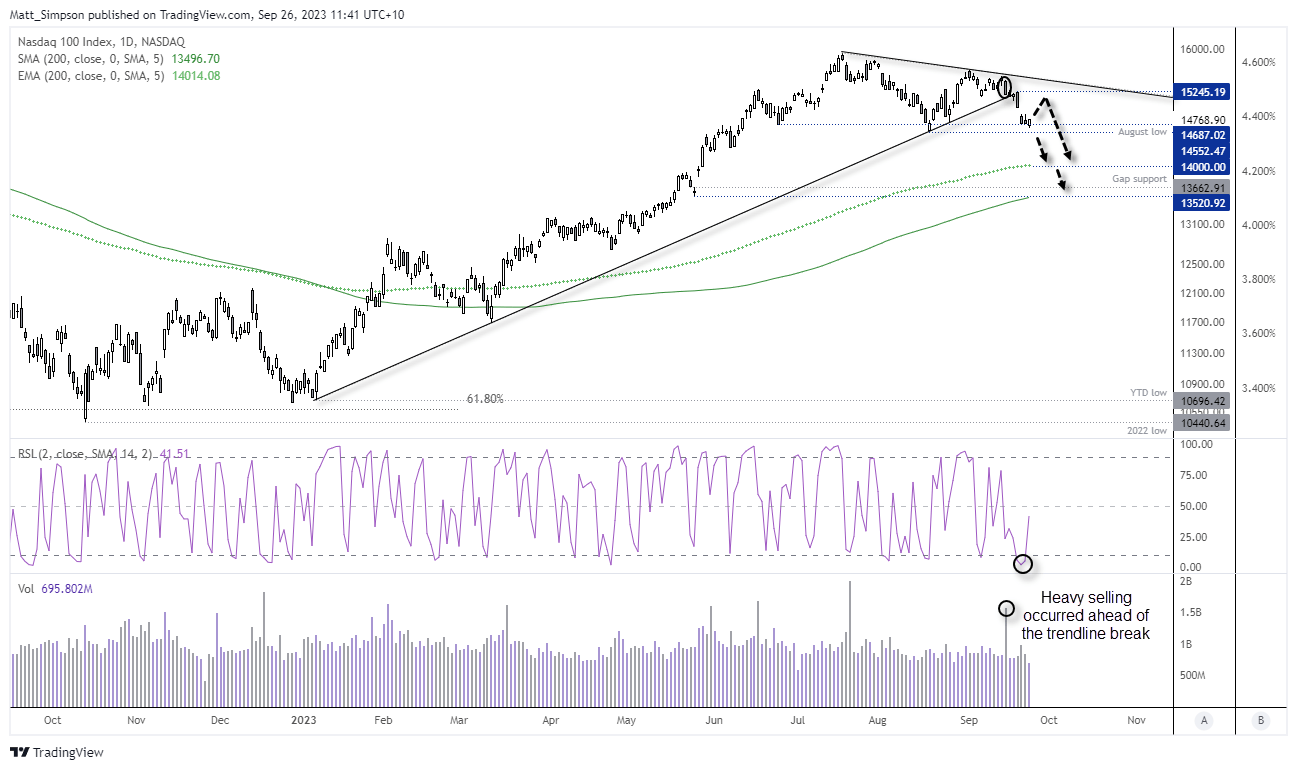
Like the Dow Jones, I’ll remain suspicious of any rally whilst yields remain elevated. Therefore, any bounce from current levels would be assumed to be corrective and I’ll then revert to seeking evidence of a swing high around levels such as 15,000 or up to the 15,245 bearish engulfing high. A break beneath the August low brings the 200-day EMA / 14,000 handle or the 200-day MA / 13,250 low into focus.
-- Written by Matt Simpson
Follow Matt on Twitter @cLeverEdge
How to trade with City Index
You can trade with City Index by following these four easy steps:
-
Open an account, or log in if you’re already a customer
• Open an account in the UK
• Open an account in Australia
• Open an account in Singapore
- Search for the market you want to trade in our award-winning platform
- Choose your position and size, and your stop and limit levels
- Place the trade
Latest market news
Yesterday 01:32 PM
Yesterday 09:35 AM
Yesterday 07:23 AM
Yesterday 04:48 AM
Yesterday 12:17 AM
July 25, 2024 10:39 PM
Latest Trade Ideas articles

Yesterday 09:35 AM

Yesterday 12:17 AM

July 25, 2024 10:39 PM

July 25, 2024 05:30 PM