October 19, 2022 3:55 PM

Canadian CPI for September was 6.9% YoY vs and expectation of 6.8% YoY and an August reading of 7%. Although the headline number was higher than expectations, it was the third straight month the inflation reading has declined since reaching a 39-year high in June. However, the Core CPI increased to 6% YoY vs an expectation of a drop to 5.7% YoY and an August reading of 5.8% YoY. The Canadian CPI release comes just hours after the UK reported an uptick in its inflation to 10.1% YoY! As inflation continues to remain high in Canada, will the BOC be less aggressive, or “pivot”, as some have suggested after the RBA reduced its pace of rate increases at its last meeting? Most likely not. Expectations are closer to a 75bps rate hike than a 50bps rate hike when the BOC meetings next Wednesday. Governor Macklem spoke earlier in the month and was hawkish, noting that further interest rate increases are warranted to tame inflation. Today’s inflation report reinforces that view. In addition, September’s Employment Change supports a higher rate hike, as the Unemployment Rate dropped from 5.4% to 5.2%.
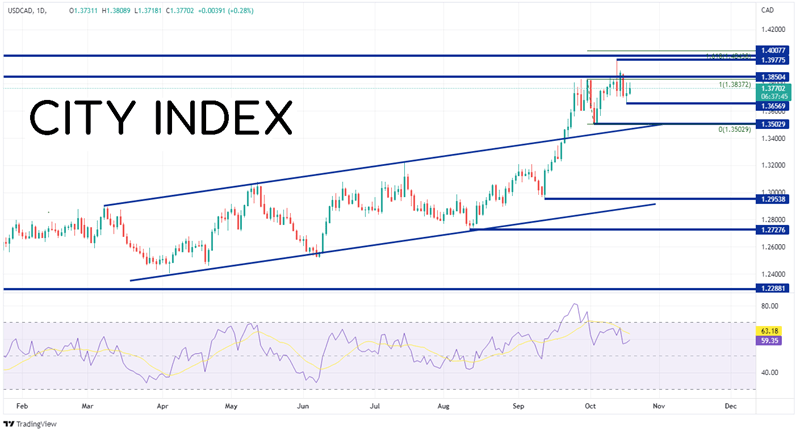
USD/CAD had been in an orderly rising channel since early April, when the pair was trading near 1.2400. On September 21st, the pair broke above the top trendline of the channel near 1.3425 and the pair hasn’t moved back inside since. USD/CAD moved to horizontal resistance from April 2020 near 1.3850, as the RSI moved into overbought territory, then pulled back to retest the top channel trendline near 1.3500. Since then, the pair spiked through the 1.3850 level on October 13th, however it was met with sellers and pulled back to 1.3657.
Source: Tradingview, Stone X
Trade USD/CAD now: Login or Open a new account!
• Open an account in the UK
• Open an account in Australia
• Open an account in Singapore
On a 240-minute timeframe, despite the pullback, USD/CAD is trading in the upper half of its recent range. First resistance is at the highs of October 13th near 1.3978. Horizontal resistance from the highs of May 2020 crosses just above there at 1.4008, and then the 161.8% Fibonacci extension from the October 13th highs to the October 18th lows near 1.4044. However, if resistance holds and the expectations increase for a 75bps rate hike next week, USD/CAD could move lower. The first support level is the low from October 18th at 1.3657. Below there, price can fall to the 38.2% Fibonacci retracement level from the lows of September 13th to the highs of October 13th, near 1.3586 and then the lows of October 4th at 1.3502.
Source: Tradingview, Stone X
Today’s release of the September CPI report increases the chances that the BOC will hike rates by 75bps next week. Over the last month, USD/CAD has been moving aggressively higher, above the top trendline of an upward sloping channel. One has to consider that the higher inflation rate and a possible rate hike of 75bps may be enough to push USD/CAD lower.
Learn more about forex trading opportunities.
Latest market news
Yesterday 01:32 PM
Yesterday 09:35 AM
Yesterday 07:23 AM
Yesterday 04:48 AM
Yesterday 12:17 AM
July 25, 2024 10:39 PM
Latest Trade Ideas articles

Yesterday 09:35 AM

Yesterday 12:17 AM

July 25, 2024 10:39 PM

July 25, 2024 05:30 PM