

Canadian Dollar Talking Points:
- USD/CAD continued to hold resistance at the 200-day moving average, as has been the case for the past four weeks.
- There’s a shorter-term range in the middle of a longer-term range in USD/CAD, and price is currently holding very near the mid-point of both.
- If looking for a breakout or possible reversal setup, CAD/JPY is bristling near multi-year resistance after setting a fresh 16-year high last week.
- I’ll be discussing these themes in-depth in the weekly webinar. It’s free for all to register: Click here to register.

USD/CAD bulls continue to get thwarted at the 200-day moving average. That’s been the case for the past four weeks now, with last week finishing as a doji after a failed resistance test at 1.3538.
Sellers have had an open door to push for a reversal for much of that time but, so far, they’ve been unable to make any headway below support running from 1.3338 up to 1.3387. The pair broke-out above this zone in the first week of the year and, so far, bulls have been able to hold the lows above. There’s a bit of reference for deeper support below that zone which could help to explain the defense that we’ve seen so far, including the bullish trendline connecting 2021 and 2022 swing lows. That trendline came into play in late 2023 and led to the bounce up to the 200-dma, so that remains notable. And below that, the 1.3200 level remains of interest, as this held support for almost two full months last summer despite a continued push from bears.
As for resistance, that’s fairly clear with the 200-day moving average holding the highs over the past four weeks, and that’s confluent with the 1.3500 psychological level. Bulls tried to push-forward last week, but the swing level at 1.3538 caught the highs again and this would remain a point of interest.
But all in all, this has been a very range-bound market and price remains very near the mid-point of that range.
USD/CAD Weekly Price Chart
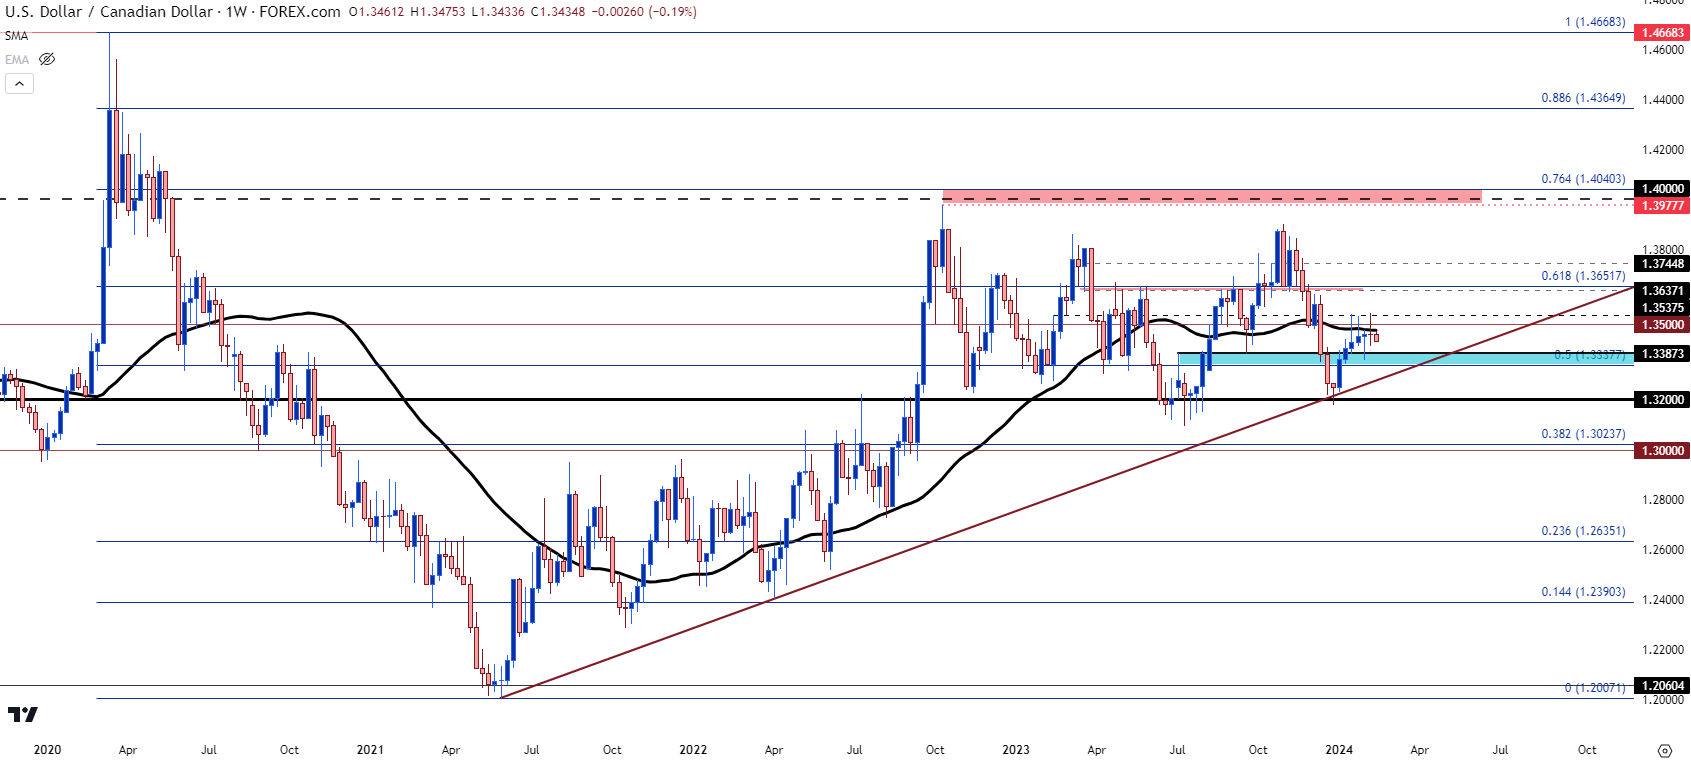 Chart prepared by James Stanley, USD/CAD on Tradingview
CAD/JPY
For those that are looking for more of a directional scenario, CAD/JPY could be of interest. The pair remains very near the fresh 16-year highs that were set last week. But bulls have, so far, had difficulty launching that breakout in a sustainable way and that’s been the case for the past few months.
From the weekly chart below, we can see price testing that fresh high last September, but then hurriedly pulled back after failing to drive through. A subsequent re-test brought a lower-high, and a deeper retracement, until support finally showed at the 200-DMA. That helped to hold the lows into the end of last year until bulls were able to re-take control, and that led to a fast movement right back up to resistance. Last week saw a touch above that prior high, leading to the fresh 16-year high. And so far, this week, buyers are back in the driver’s seat and testing another breakout.
CAD/JPY Weekly Price Chart
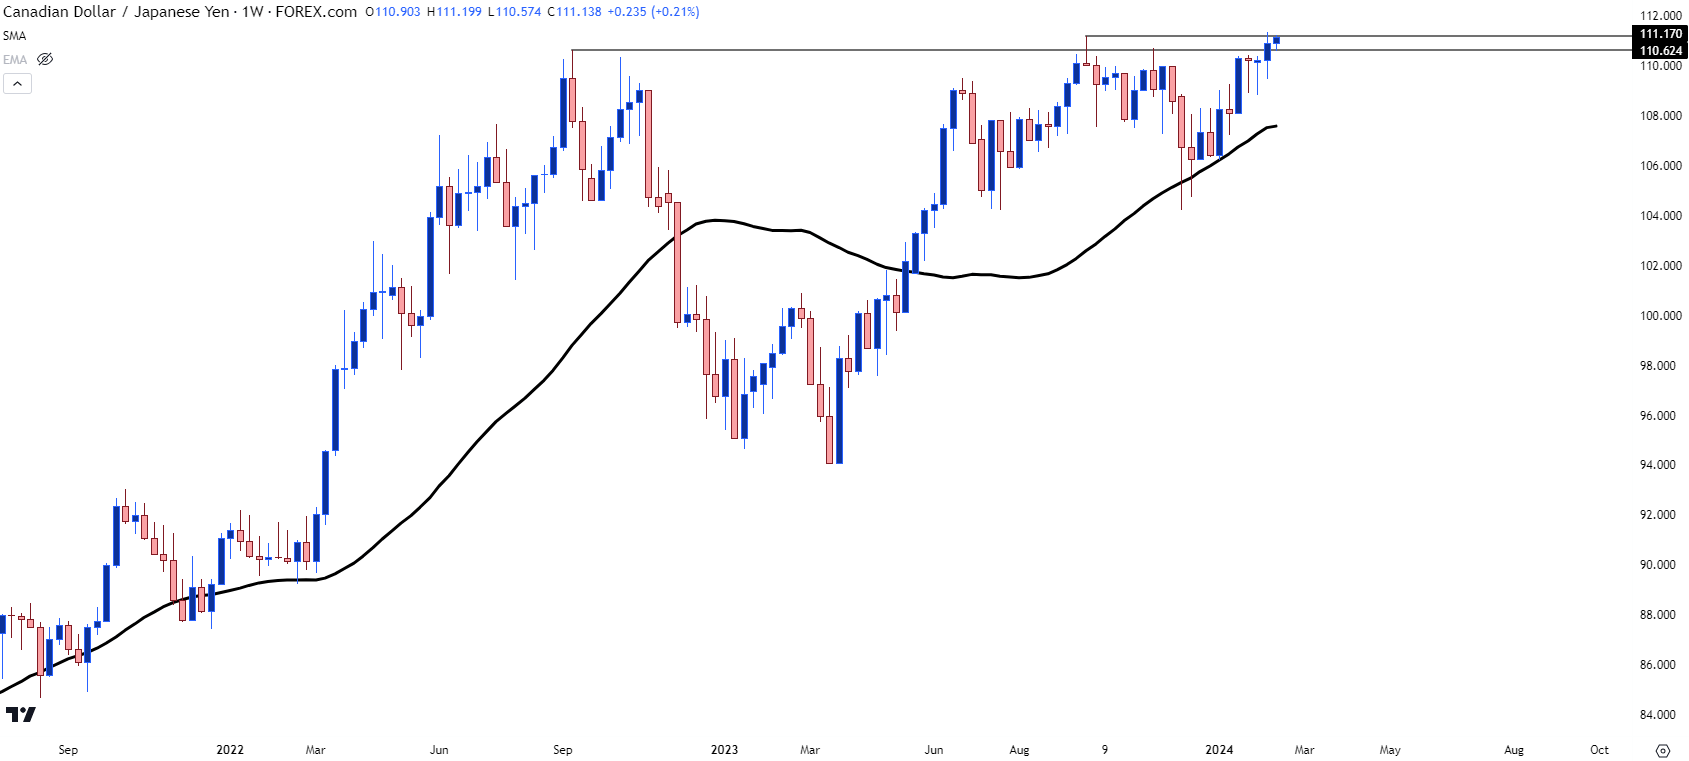 Chart prepared by James Stanley, CAD/JPY on Tradingview
Reversal Potential
Given the fresh 16-year high set last week combined with the resilience shown by bulls in driving right back to that line-in-the-sand, one would have to assume that bulls are in control here. But, with the continued posturing near resistance, the other side can be investigated, as well, particularly for those looking to work reversal scenarios.
The motive for such would likely emanate from the fundamental side. Carry remains positive on CAD/JPY, similarly to USD/JPY, so there’s still motive for bulls on the long side of the pair. But the bigger concern would be intervention or some element of shift around USD/JPY as the pair nears a re-test of the 150.00 psychological level. That’s the price that’s brought out the commentary from the Japanese Finance Ministry over the past two years and the zone from 150-152 has led to two strong and aggressive reversals.
From where we’re at now, it would seem like something of that nature would be needed to really spark reversal potential in JPY-pairs, CAD/JPY included.
From the daily chart below, we can see some of that continued posturing, with price holding after a breakout attempt last week. In red, I’ve marked the 2023 swing high at 111.17 that was tested through last week and is being tested again, as of this writing. Just below that, at 110.62 is the 2022 swing high, which has so far held the lows today. And at 111.33, in blue, we have the recently-established 16-year high that was set last week. And the current daily bar is showing a strong response to that support test, setting up bulls for another run at the highs.
The reversal scenario becomes of interest if bulls fail to drive after setting a fresh high, and this could be tracked by looking for an initial test below 111.17, after which that 110.62 level comes into view. If bears can drive below that after a failed breakout, that’ll give the reversal theme a bit more attraction.
CAD/JPY Daily Price Chart
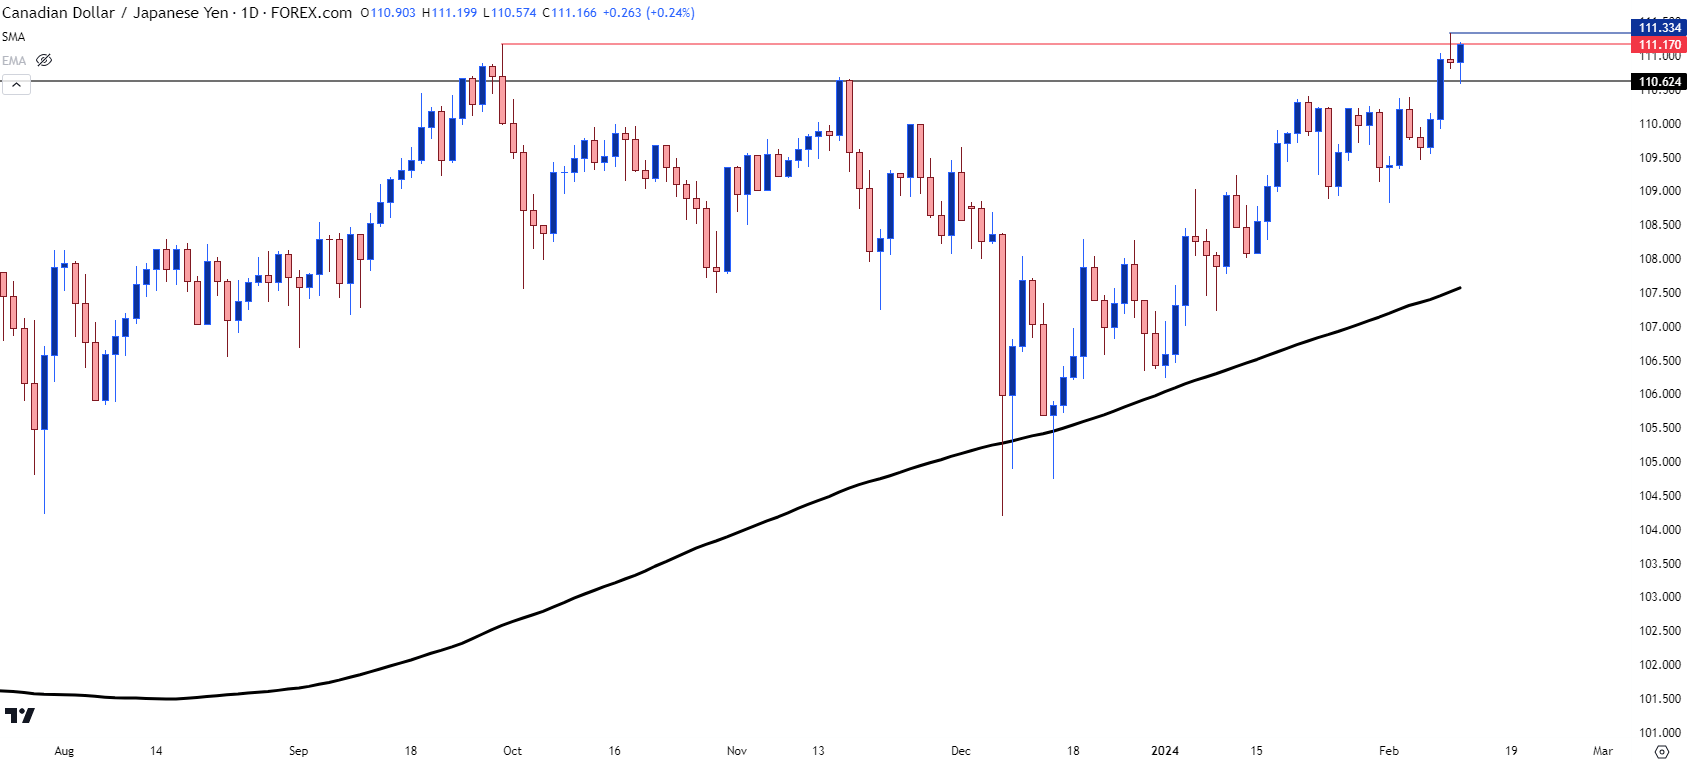 Chart prepared by James Stanley, CAD/JPY on Tradingview
--- written by James Stanley, Senior Strategist
Latest market news
Yesterday 01:32 PM
Yesterday 09:35 AM
Yesterday 07:23 AM
Yesterday 04:48 AM
Yesterday 12:17 AM
July 25, 2024 10:39 PM
Latest James Stanley articles

May 25, 2024 08:00 PM
May 4, 2024 08:00 PM

April 28, 2024 08:00 AM
March 29, 2024 10:00 PM