

British Pound Talking Points:
- It was a big week for GBP/USD as the pair finally put in some strength above the 1.2500 psychological level. With the Fed still sounding somewhat dovish, GBP/USD could be one of the more attractive majors for scenarios of USD-weakness.
- GBP/JPY finally finished off the gap from 2008, which ran all the way up to the 198.08 level. As trading opened for the week a significant move of Yen-weakness propelled GBP/JPY all the way past the 200 level, albeit temporarily, and then as the BoJ intervened the pair showed a strong pullback. But fundamentals remain divergent between the U.K. and Japan and the Bank of England rate decision next week will put this theme back in the spotlight.

The big item for the British Pound in the week ahead is a Super Thursday rate decision, which the bank will also offer updated projections and guidance. While the BoE is widely expected to hold rates flat, the big question remains what’s on the horizon, and when we last heard from the BoE they sounded somewhat dovish and that prodded a run of weakness in GBP.
The big question around the BoE is the same as the Fed or the European Central Bank: When will they begin to cut interest rates? The updated projections furnished next Thursday can provide some sort of clue.
After a drubbing in the pair from the March high to the April low, bulls have been on their way back, and this week saw the pair pose two tests above the 200-day moving average. The second test made it a bit further than the first but bulls weren’t able to hold the bid as price pulled back into the close. But, notably, GBP/USD showed capacity to trend above the 1.2500 psychological level, and that also marks a fresh higher-high to go with the higher-lows that had built in the 1.2460-1.2500 zone.
This could present GBP/USD as one of the more attractive majors to work with for scenarios of USD-weakness.
GBP/USD Daily Price Chart
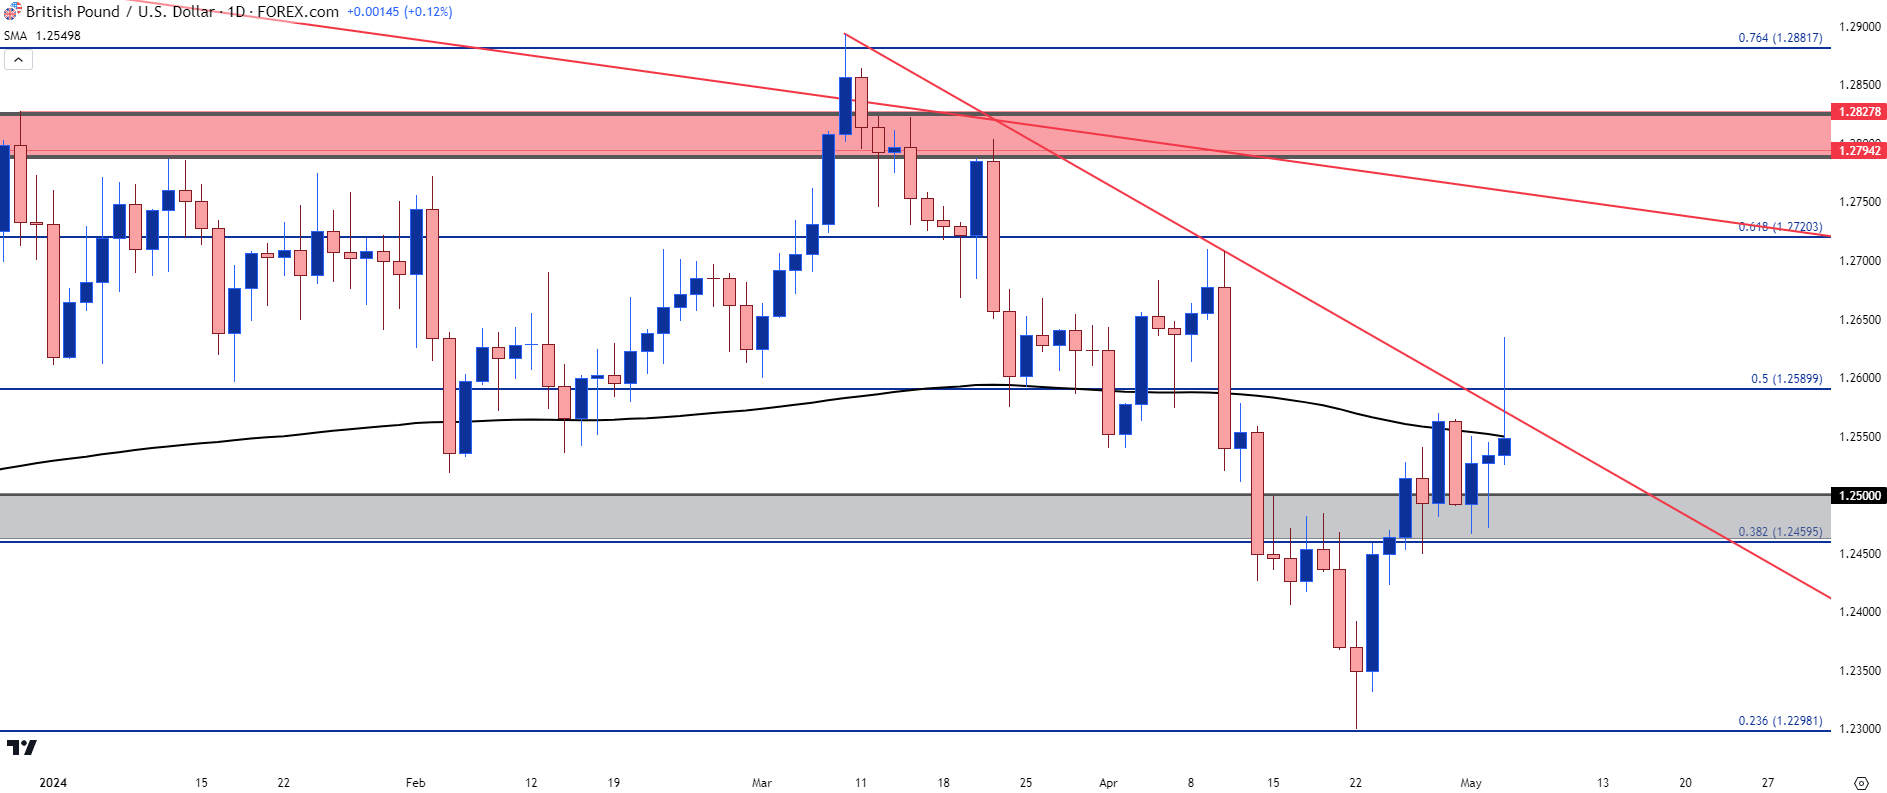 Chart prepared by James Stanley, GBP/USD on Tradingview
GBP/USD Longer-Term
The longer-term chart remains of interest here and below, I’m looking at the monthly GBP/USD outlay. There’s a long-term resistance trendline sitting overhead but perhaps more interesting than that is the importance of support around the 1.2500 level. There’s a prior resistance swing at 1.2447, and a Fibonacci level at 1.2482. After an attempted breakdown in April, bulls were able to pull price back above that spot and at this point, it remains of interest for support which can keep the door open for a test of the longer-term bearish trendline.
GBP/USD Monthly Price Chart
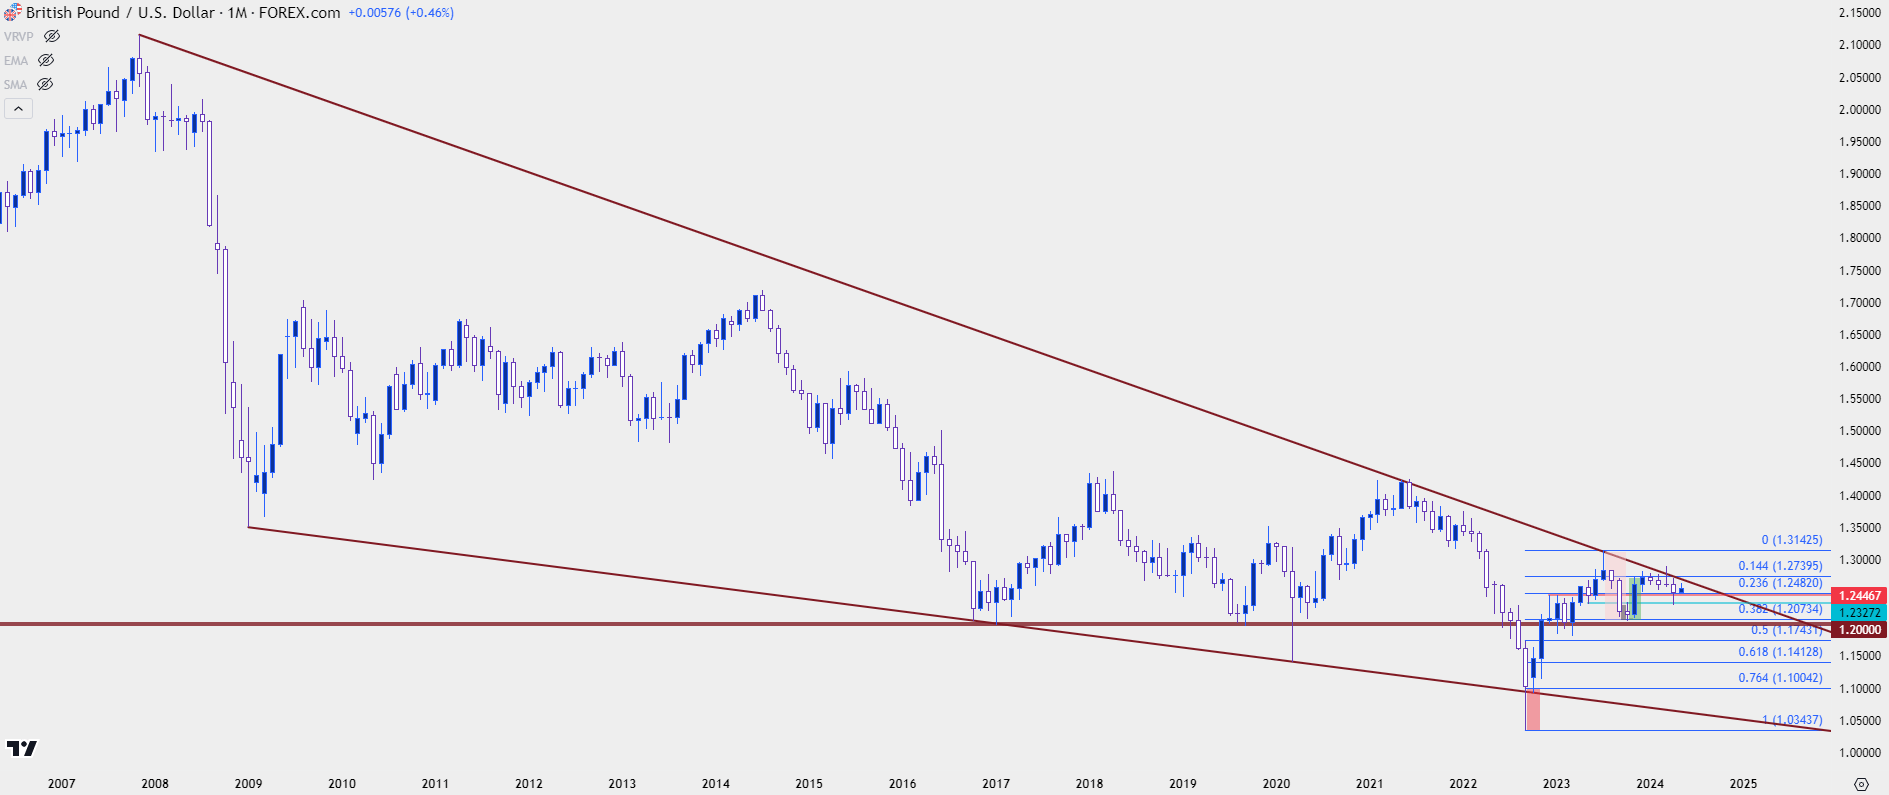 Chart prepared by James Stanley, GBP/USD on Tradingview
GBP/JPY
The week started with a bang in GBP/JPY.
I’ve been talking about a long-term gap here for some time. The gap comes from the Financial Collapse in 2008, when September opened almost 500 pips below the August close. And matters were so worrying at the time that the pair didn’t really look back as JPY-strength overpowered the Pound as the pair plummeted to fresh lows.
Shinzo Abe came into the picture in 2012 and Yen-weakness was all the rage. In GBP/JPY, that lasted until price began to find resistance at the bottom of that gap which plots at 193.61. Bulls tried to break-through for two months until the third month saw bears take-over in a big way, leading to a precipitous decline that ran into late-2016.
The bottom of that gap started to come back into the equation in March, helping to hold the highs. And bulls remained persistent, continue to push until this week finally saw GBP/JPY finish it off on the way to a test above the 200-handle for the first time since August of 2008.
GBP/JPY Monthly Price Chart
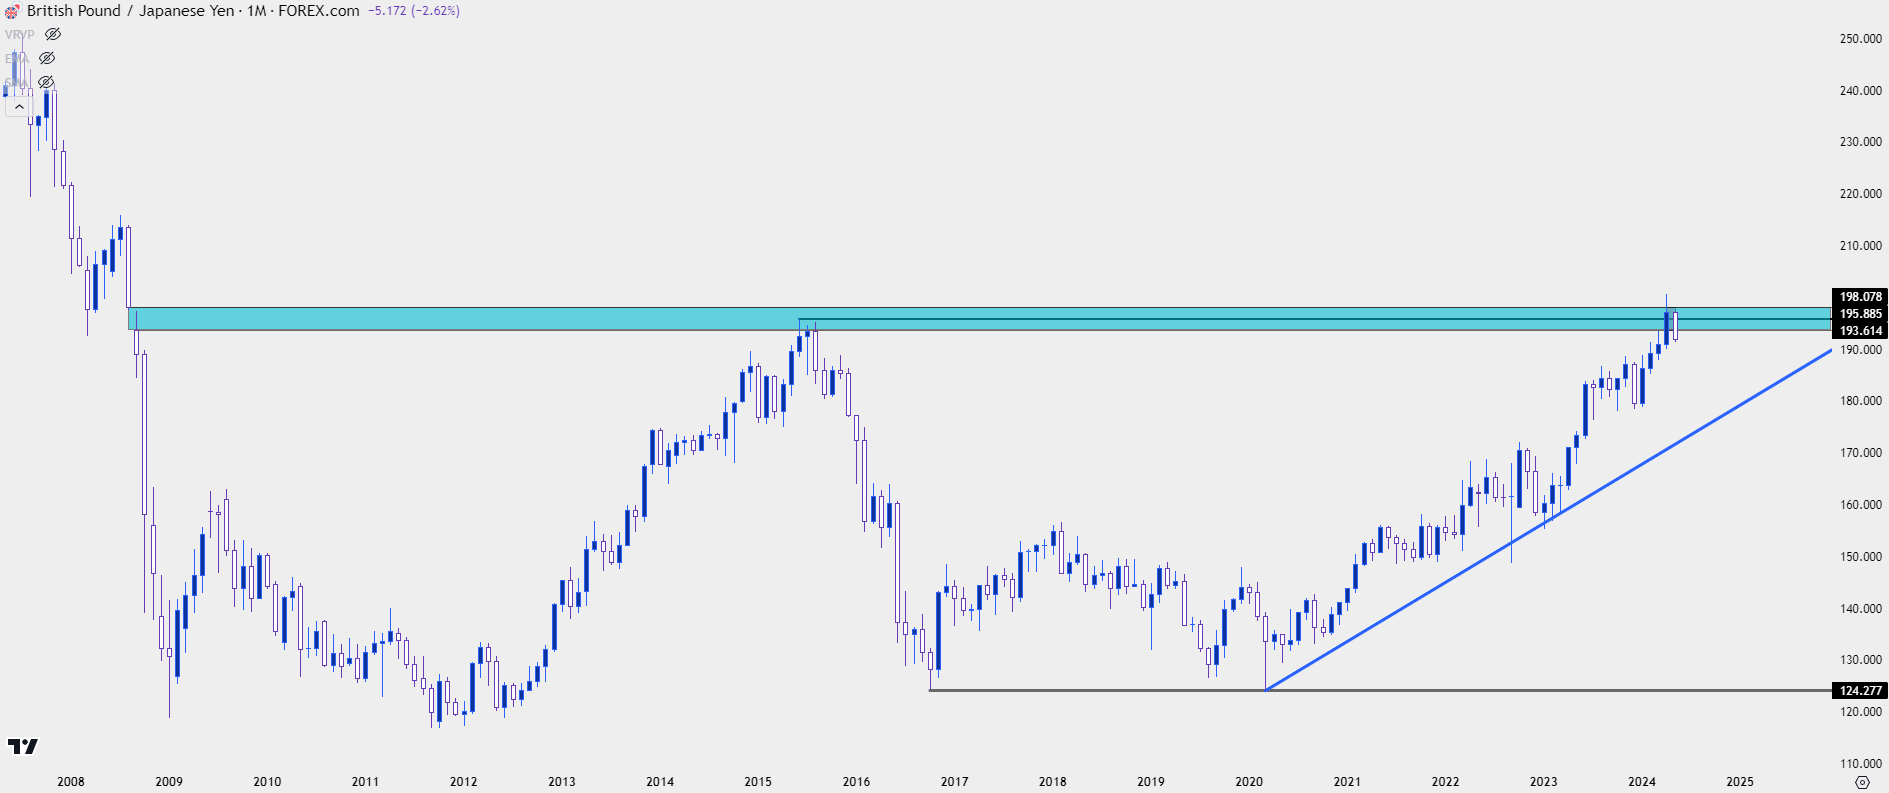 Chart prepared by James Stanley, GBP/JPY on Tradingview
It wasn’t long after that 200-print that the Bank of Japan intervened. And they were back at it on Wednesday after the FOMC, which further helped to claw back prior JPY-losses. But, as I had discussed relevant to USD/JPY, the core problem remains, which is fundamental divergence between the Bank of Japan and the Fed or Bank of England. This puts focus on the BoE meeting on Thursday as any signs of ‘less dovish’ from the Bank of England could further expose that divergence.
The weekly bar of GBP/JPY was ugly: It wasn’t quite a bearish engulf as the opens matched and it wasn’t quite an outside bar as the lows could not test through the prior week’s lows. But, nonetheless, it was a statement from bears that can send a similar message as either of those formations, that something may be shifting in the backdrop.
But, given the fact that this can be explained by an exogenous driver of intervention, that can keep the focus on support to see if bulls line back up to continue the topside trend. There’s a prior swing of resistance at 191.32 that remains of interest for that theme, as bulls held the low above that price this week. And then the 190.00 psychological level looms large underneath. Below that, there’s another spot of possible support from prior resistance at 188.53.
GBP/JPY Weekly Price Chart
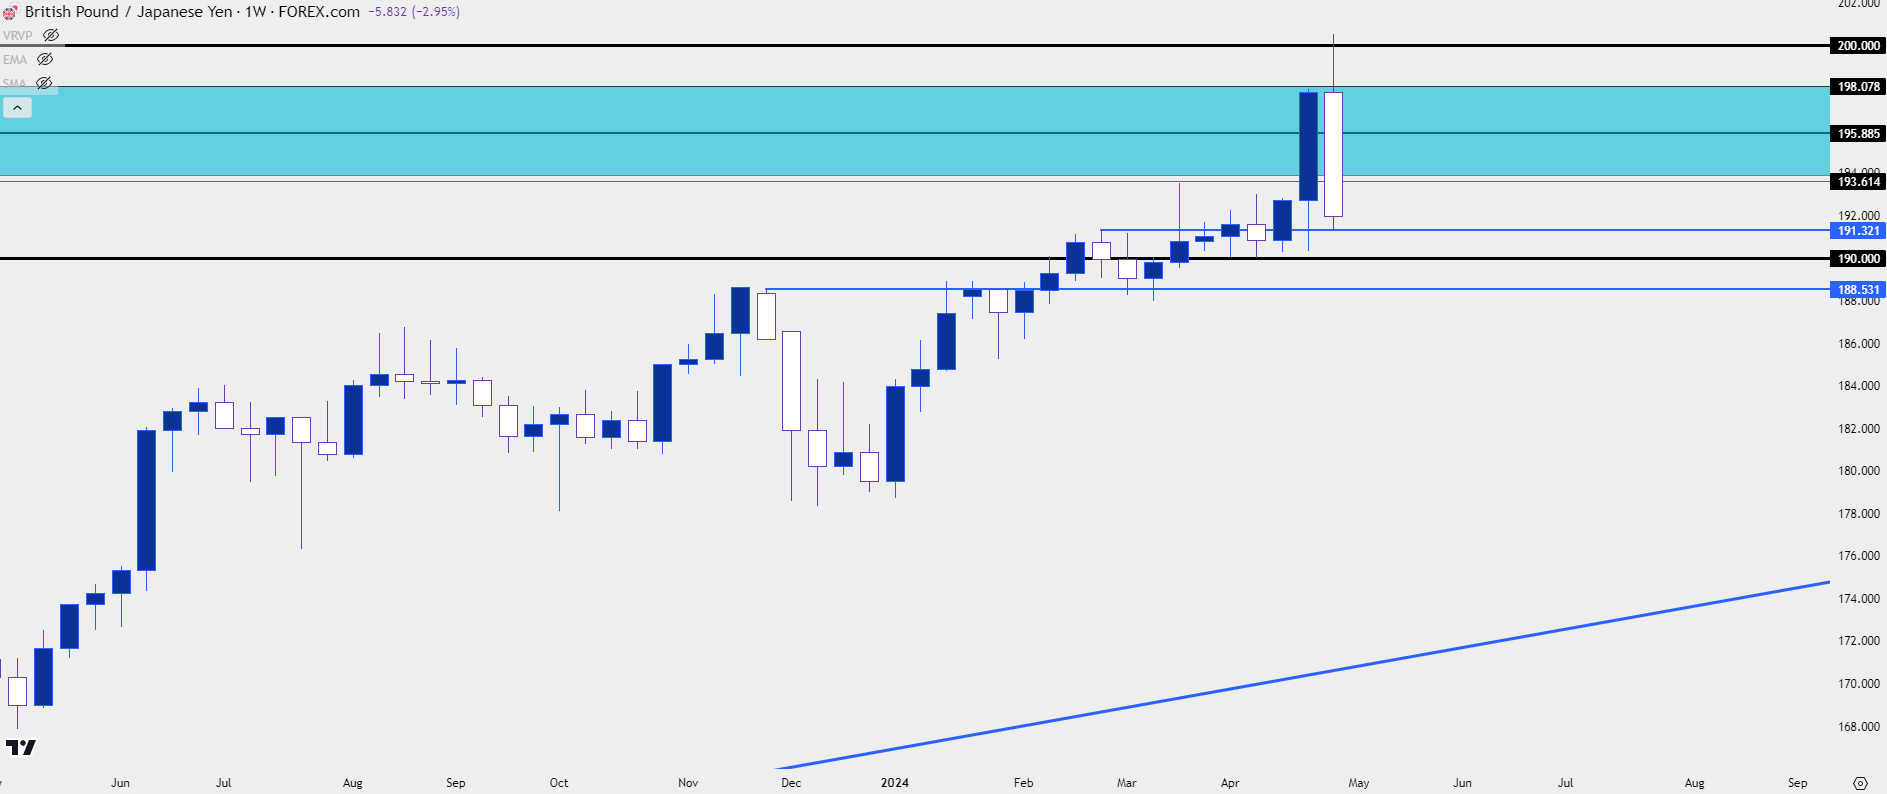 Chart prepared by James Stanley, GBP/JPY on Tradingview
EUR/GBP
EUR/GBP continues to show indications of digestion and that’s pretty much been the name of the game in the pair for 2024 trade. The .8500 handle came into play in February and that’s led to a choppy backdrop of minimal volatility.
From the weekly chart below, there’s a couple of different formations in-play. There’s a descending triangle as taken from horizontal support at the .8500 level and the lower highs since the 2023 open. And then there’s a bullish channel from this year’s chop which, when taken in context of the prior sell-off, presents a bear flag formation.
And on the fundamental front there’s some interest, as well, as European inflation has slowed down more than what’s shown in the U.K., where Core CPI surprised to the upside last month, coming in at 4.2% v/s the 4.1% expectation. Meanwhile, the preliminary read for April inflation out of Europe was at 2.7%; so, if we’re looking at which bank may cut first, at least from the data, the ECB would appear to be ahead of the Bank of England.
Collectively this can open the door for bearish breakout potential in the pair. There’s a spot of possible lower-high resistance around prior support of .8616 after which the bearish trendline comes into the picture, which for next week projects to around .8645.
EUR/GBP Weekly Price Chart
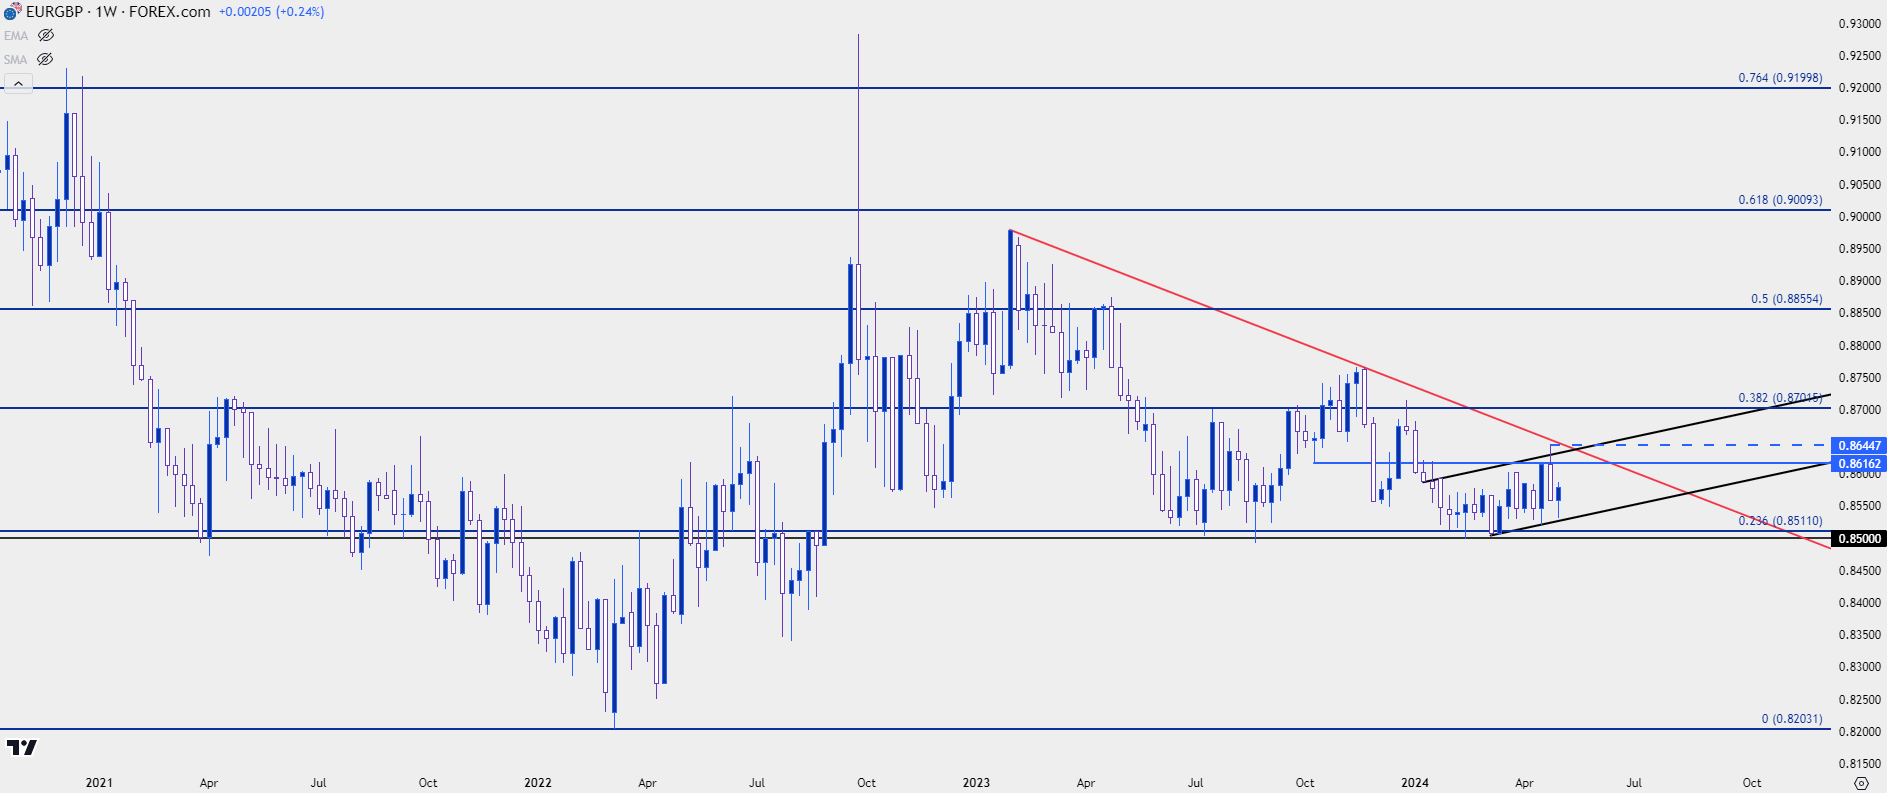 Chart prepared by James Stanley, EUR/GBP on Tradingview
--- written by James Stanley, Senior Strategist
Latest market news
Yesterday 01:32 PM
Yesterday 09:35 AM
Yesterday 07:23 AM
Yesterday 04:48 AM
Yesterday 12:17 AM
July 25, 2024 10:39 PM
Latest James Stanley articles

May 25, 2024 08:00 PM
May 4, 2024 08:00 PM

April 28, 2024 08:00 AM

March 20, 2024 07:30 PM