

Asian Futures:
- Australia's ASX 200 futures are up 13 points (0.18%), the cash market is currently estimated to open at 7,383.80
- Japan's Nikkei 225 futures are up 10 points (0.03%), the cash market is currently estimated to open at 29,657.08
- Hong Kong's Hang Seng futures are up 367 points (1.46%), the cash market is currently estimated to open at 25,521.32
- China's A50 Index futures are up 25 points (0.16%), the cash market is currently estimated to open at 15,793.14
UK and Europe:
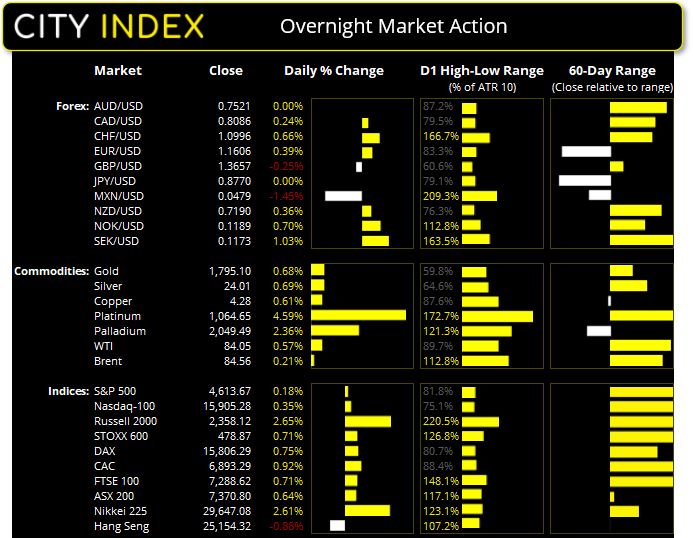
- UK's FTSE 100 index rose 51.05 points (0.71%) to close at 7,288.62
- Europe's Euro STOXX 50 index rose 29.91 points (0.7%) to close at 4,280.47
- Germany's DAX index rose 117.52 points (0.75%) to close at 15,806.29
- France's CAC 40 index rose 62.95 points (0.92%) to close at 6,893.29
Monday US Close:
- The Dow Jones Industrial rose 94.28 points (0.26%) to close at 35,913.84
- The S&P 500 index rose 8.29 points (0.19%) to close at 4,613.67
- The Nasdaq 100 index rose 54.806 points (0.35%) to close at 15,905.28
Indices: Prices and delivery times rise as productivity falls
Rising prices and bottlenecks weighed on productivity, according to October’s ISM manufacturing report. The headline index slipped to 60.8 from 61.6, although it has expanded for 17 consecutive months and remains relatively high. New orders fell to a 14-month low of 59.8 and the imports index contracted at 49.1 as bottlenecks weighed on demand and caused supplier deliveries to rise to 75.5. Prices rose to a 3-month high of 85.7. All 18 industries reported slower delivery supply in October. Whichever way you look at it bottlenecks remain apparent in the supply chain and will likely remain an inflationary force, until we see a persistent drop in demand.
Yet US equity markets took their cue from another strong earnings session with company profits rising more than average. As of Friday, the S&P 500 earnings growth for the S&P 500 was up an estimated 39.2%, materials and industrials were up 91.9% and 85.2% respectively, whilst the energy sector’s growth was a staggering 1713.1%.
All three large-cap indices on Wall Street closed to a record high, with the Nasdaq rising 0.35%, the Dow was up 0.26% and the S&P 500 up 0.18%. The Russell 2000 rose 2.65%, Nasdaq banks (IKBK) rose 2.7%.
The ASX 200 found support at its 200-bar eMA on the 4-hour chart and printed a bullish engulfing candle, yet it’s not out of the woods yet as it only recouped around 50% of Friday’s losses. 7400 is the next resistance level for bulls to conquer, otherwise any weakness below it could tempt bearish swing traders.
ASX 200 Market Internals:
ASX 200: 7370.8 (0.64%), 01 November 2021
- Telecomm Services (2.32%) was the strongest sector and Financials (-0.48%) was the weakest
- 10 out of the 11 sectors closed higher
- 1 out of the 11 sectors closed lower
- 8 out of the 11 sectors outperformed the index
- 156 (78.00%) stocks advanced, 36 (18.00%) stocks declined
- 67.5% of stocks closed above their 200-day average
- 53.5% of stocks closed above their 50-day average
- 55.5% of stocks closed above their 20-day average
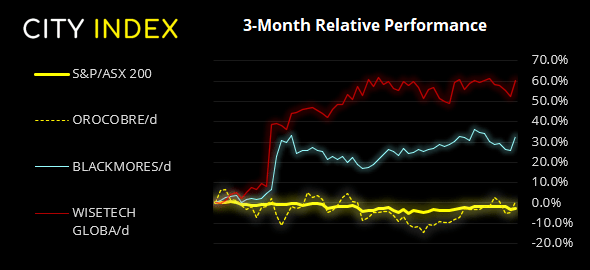
Outperformers:
- + 5.8%-Orocobre Ltd(ORE.AX)
- + 5.5%-Blackmores Ltd(BKL.AX)
- + 5.4%-WiseTech Global Ltd(WTC.AX)
Underperformers:
- ·-7.3%-Westpac Banking Corp(WBC.AX)
- ·-4.9%-Resmed Inc(RMD.AX)
- ·-4.1%-St Barbara Ltd(SBM.AX)
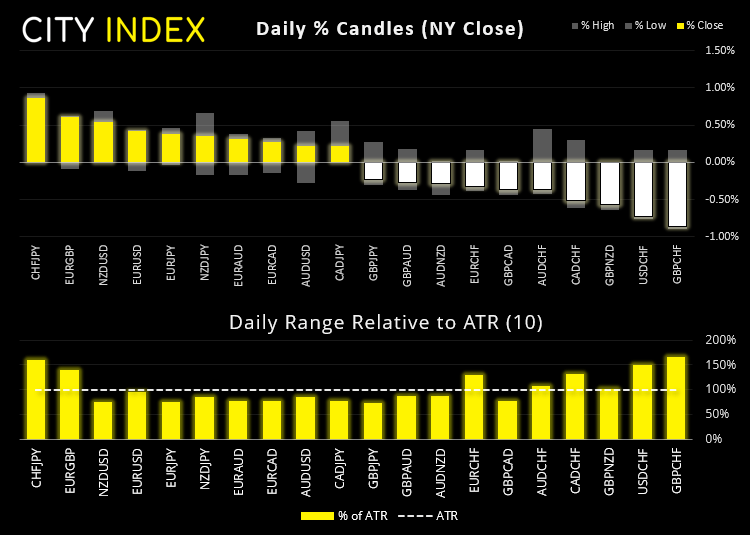
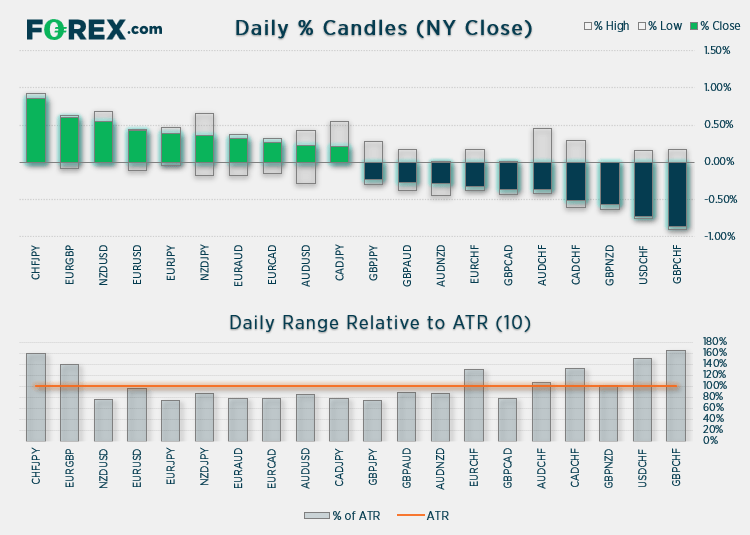
Forex: AUD/CHF falls to pivotal zone ahead of RBA
RBA’s cash rate meeting at 14:30 AEDT today is the main calendar event in the Asian session. Given the noteworthy rise in inflation and market expectations for multiple hikes, we’re keen to see any comments on the RBA on market positioning; will they try and pop the frenzy and call out hawkish positioning, or admit the markets are correct (less likely in my personal view, as they’re generally the more ‘reserved’ central banks in recent history).
AUD/USD printed an indecision candle ahead of today’s meeting (Doji) and trades around 0.7500. A break above last week’s high is required to extend its bullish trend (and for RBA to swing their hawkish bat today). Failure to do so could weigh on AUD at these highs ahead of the FOMC meeting.
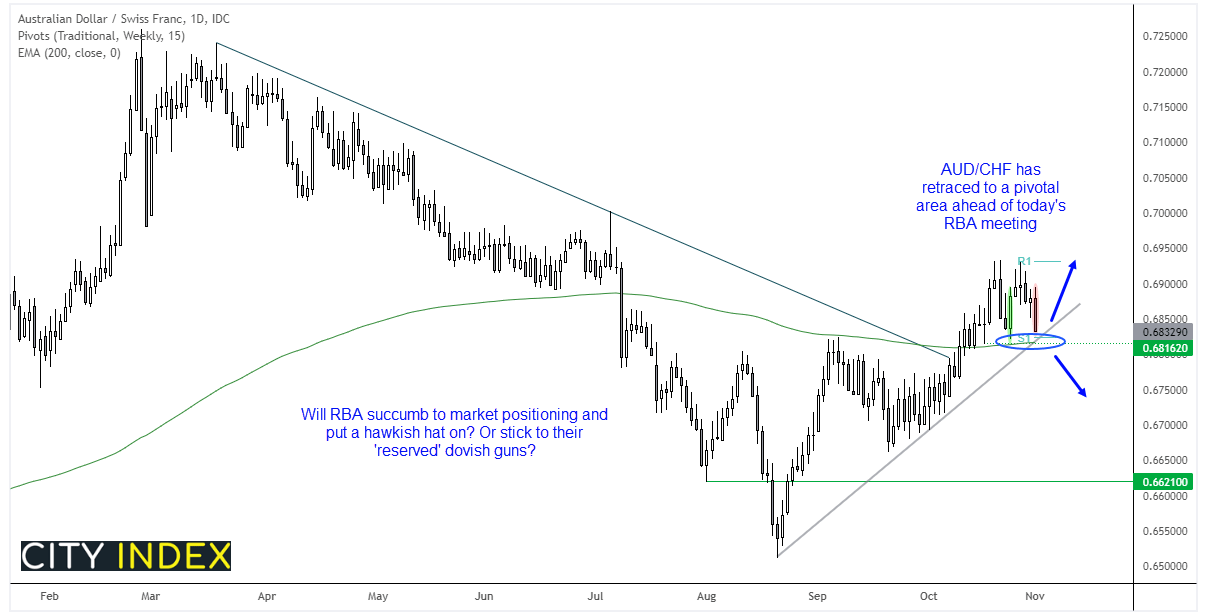
But AUD/CHF has caught out eye as it sits at a pivotal area, having printed a bearish engulfing candle overnight. The daily chart is within an uptrend although in a countertrend move. Prices are holding above trend support, the weekly S1 pivot, 200-day eMA and previous bullish engulfing candle. A slightly more hawkish RBA could send AUD/CHF higher from current levels, given the several levels of support nearby. Yet if they stick to their dovish guns despite market positioning goading them into action, perhaps we’ll see these support levels break, trigger a few stops and embark on its next leg lower.
USD/CHF fell to a 3-month low and the Swiss franc was broadly higher overnight. Which is interesting as it was only in yesterday’s COT report that we flagged that CHF futures may be approaching a sentiment extreme due to a lack of bullish activity and rising prices. Keep in mind we have the FOMC meeting in the early hours of Thursday but, for now, the 200-day eMA is capping as resistance.
Commodities:
A weaker dollar helped lift commodity markets overnight. Gold managed to lift itself up from Friday’s low and form a bullish inside day. Yet the candle’s range is stuck between the 50 and 200-day eMA’s (with 200 capping as resistance). Our bias remains as yesterday; we suspect new lows could materialise whilst 1800 caps as resistance, and a break beneath 1780 (or Friday’s low) suggests its next move lower is underway.
Platinum accelerated higher and broke above 1035.7 to trigger our bullish bias. The breakout was also on higher volume and confirms Friday’s Doji at trend support and the 50-day eMA as a major swing know.
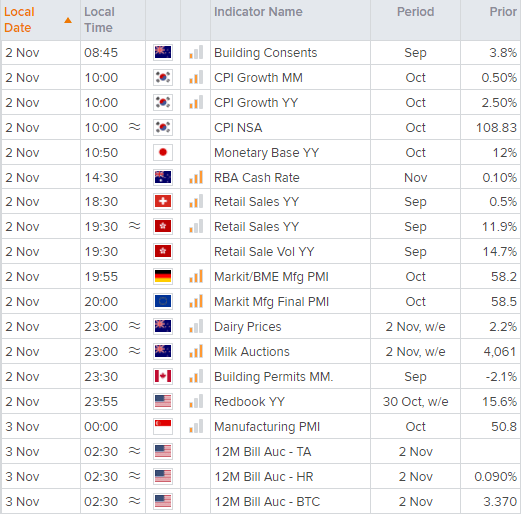
Up Next (Times in AEDT)
How to trade with City Index
You can trade easily trade with City Index by using these four easy steps:
-
Open an account, or log in if you’re already a customer
• Open an account in the UK
• Open an account in Australia
• Open an account in Singapore
- Search for the company you want to trade in our award-winning platform
- Choose your position and size, and your stop and limit levels
- Place the trade
Latest market news
Yesterday 01:32 PM
Yesterday 09:35 AM
Yesterday 07:23 AM
Yesterday 04:48 AM
Yesterday 12:17 AM
July 25, 2024 10:39 PM
Latest Trade Ideas articles

Yesterday 09:35 AM

Yesterday 12:17 AM

July 25, 2024 10:39 PM

July 25, 2024 05:30 PM