December 29, 2021 4:10 PM

When traders refer to looking at a correlation between to assets, they are often referring to the correlation coefficient, which is a statistical measure of the strength of the relationship between the relative movement of 2 variables, according to Investopedia. The two are terms are often used interchangeably. The strength of the relationship ranges from -1.00 to +1.00. A reading of -1.00 means that there is a perfect negative correlation between the 2 assets. They move in the opposite direction relative to each other 100% of the time. A reading of +1.00 means that there is a perfect positive correlation between the 2 assets. They move in the same direction relative to each other 100% of the time. A reading of 0.00 means that there is no correlation between the 2 assets. For the correlation coefficient to be significant, traders should look for readings below -0.80 or above +0.80.
Why do traders use correlations?
Traders look at correlations for 2 reasons:
- To compare an asset to a benchmark
- To look for opportunities for diversify
Using correlation to compare an asset to a benchmark
Traders may wish to buy an asset they may not have access to. One-way traders can use a correlation coefficient is to look for a high positive or negative correlation between an asset they want to own and the asset they can own and use the former one as a proxy. For example, many foreign exchange traders don’t have access to the US Dollar Index (DXY). Therefore, traders can look for an asset with a strong correlation coefficient to the DXY, such as EUR/USD and trade that instead.
Trade EUR/USD now: Login or Open a new account!
• Open an account in the UK
• Open an account in Australia
• Open an account in Singapore
On the bottom of the DXY chart below is the correlation coefficient between DXY and EUR/USD. The current reading is -0.94 on a daily timeframe. This is considered a strong, negative correlation. Therefore, because the correlation is negative, if one wants to own DXY, that traders can just sell EUR/USD (buy US Dollars).
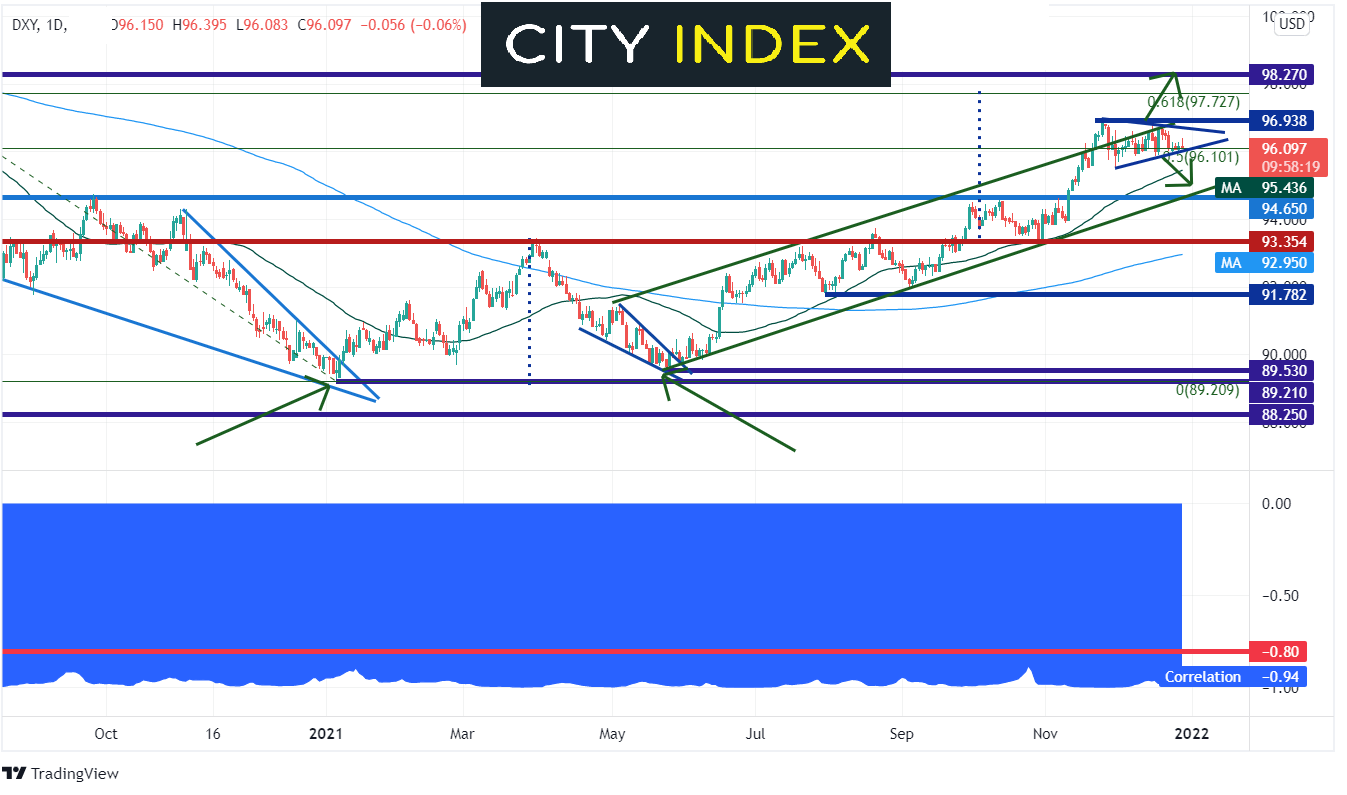
Source: Tradingview, Stone X
Using correlations to look for opportunities to diversify
A trader may be holding an asset which may seem risky for him or her to hold onto. Therefore, that person may wish to diversity, or hedge, against that asset. For example, a trader sees a great opportunity for own Crude Oil but may wish to diversity the asset in his or her portfolio. Crude Oil and the Norwegian Krone have a strong negative correlation. Therefore, the trader can buy both Crude Oil and USD/NOK (sell NOK) to help take away some of the risk of owning Crude oil.
Trade USD/NOK now: Login or Open a new account!
• Open an account in the UK
• Open an account in Australia
• Open an account in Singapore
On the bottom of the WTI oil chart below is the correlation between the continuous Crude Oil futures contract and USD/NOK. The current reading is -0.89 on a daily timeframe. This is considered a strong, negative reading. If one wants to diversify the crude oil holdings, he or she can just buy USD/NOK.
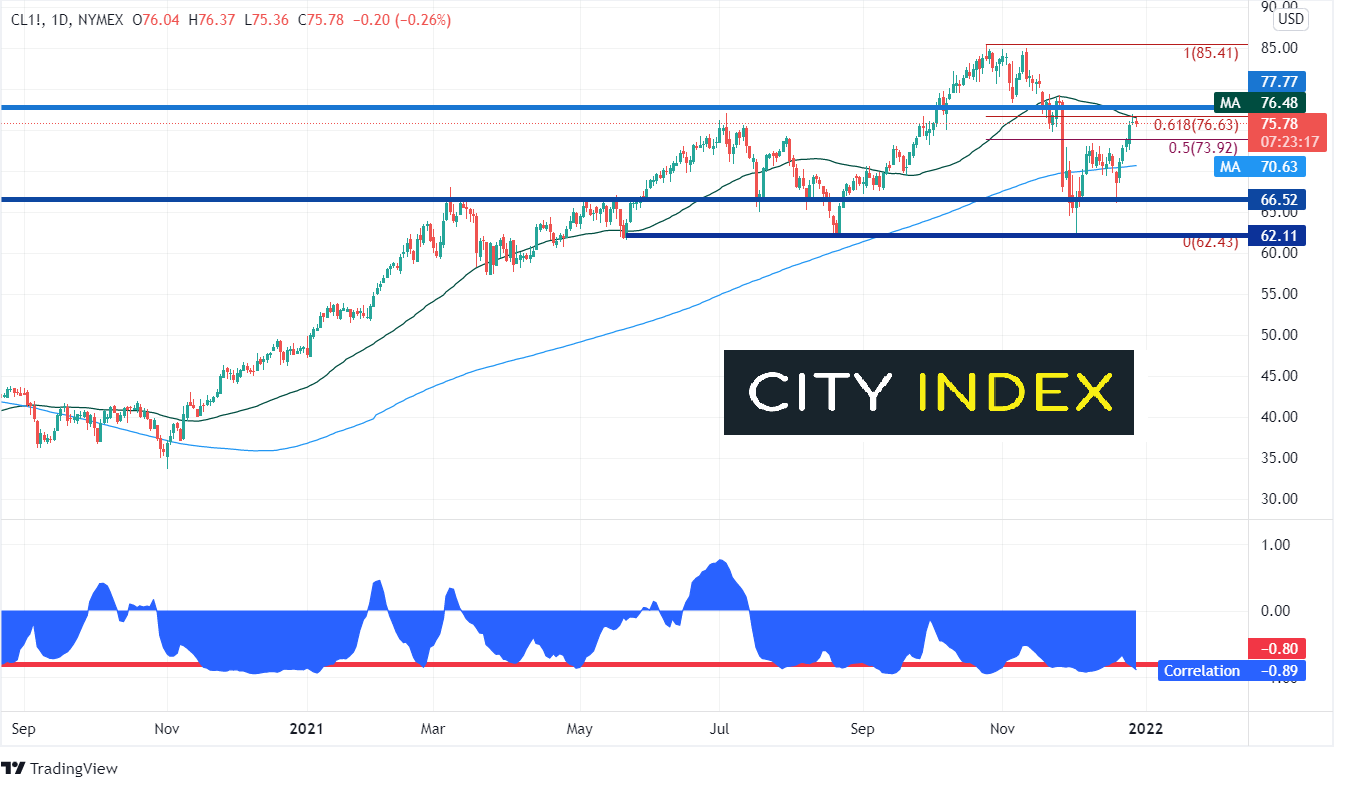
Source: Tradingview, Stone X
One thing that is important to note about correlations is that they fall in and out of favor. Traders should be aware of when the correlation coefficient moves above -0.80 or below +0.80, as the reading would not be considered a useful tool to help them trade.
Correlations can be useful tools for help in trading if used correctly. Traders should look for readings below -0.80 or above +0.80 for the correlation coefficient to be considered significant.
Learn more about forex trading opportunities.
Latest market news
Yesterday 06:37 AM
April 26, 2024 01:25 PM
April 26, 2024 11:40 AM
April 25, 2024 03:09 PM
Latest Forex articles


April 26, 2024 11:40 AM
April 24, 2024 03:14 PM
April 24, 2024 11:00 AM