


- US benchmark Treasury futures look to be breaking higher, implying lower yields ahead
- TLT ETF should outperform if US yields were to push lower
- Tuesday’s US CPI report looms as a make-or-break event for long bond bulls
Longer-dated US bonds are threatening to break higher into what’s arguably the most important US CPI report in nearly a year. What happens next will be important for financial markets given the implications for global borrowing costs.
US benchmark bond futures breaking higher
Last week I nominated US 10-year bond futures as the most important chart in the financial world in early 2024, noting it had broken its 200-day moving average before doing away with a horizontal level that had acted as support and resistance on numerous occasions dating back six months.
As futures tend to drive movements in Treasury markets, the development signaled the possibility that US bond yields may continue pushing lower, an outcome that would have implications for multiple asset classes.
For those who would like the delve a little deeper, you can read the full note here.
When it comes to assets likely to benefit from bullish bond breakout, few screen as strongly as iShares’ 20-Year plus Treasury Bond ETF, known for its ticker code ‘TLT’. With US 10-year futures threatening to break higher, it suggests Treasuries with longer maturities may do the same, pointing to potential upside for TLT given it tracks a basket of bonds with 20-years or longer until maturity.
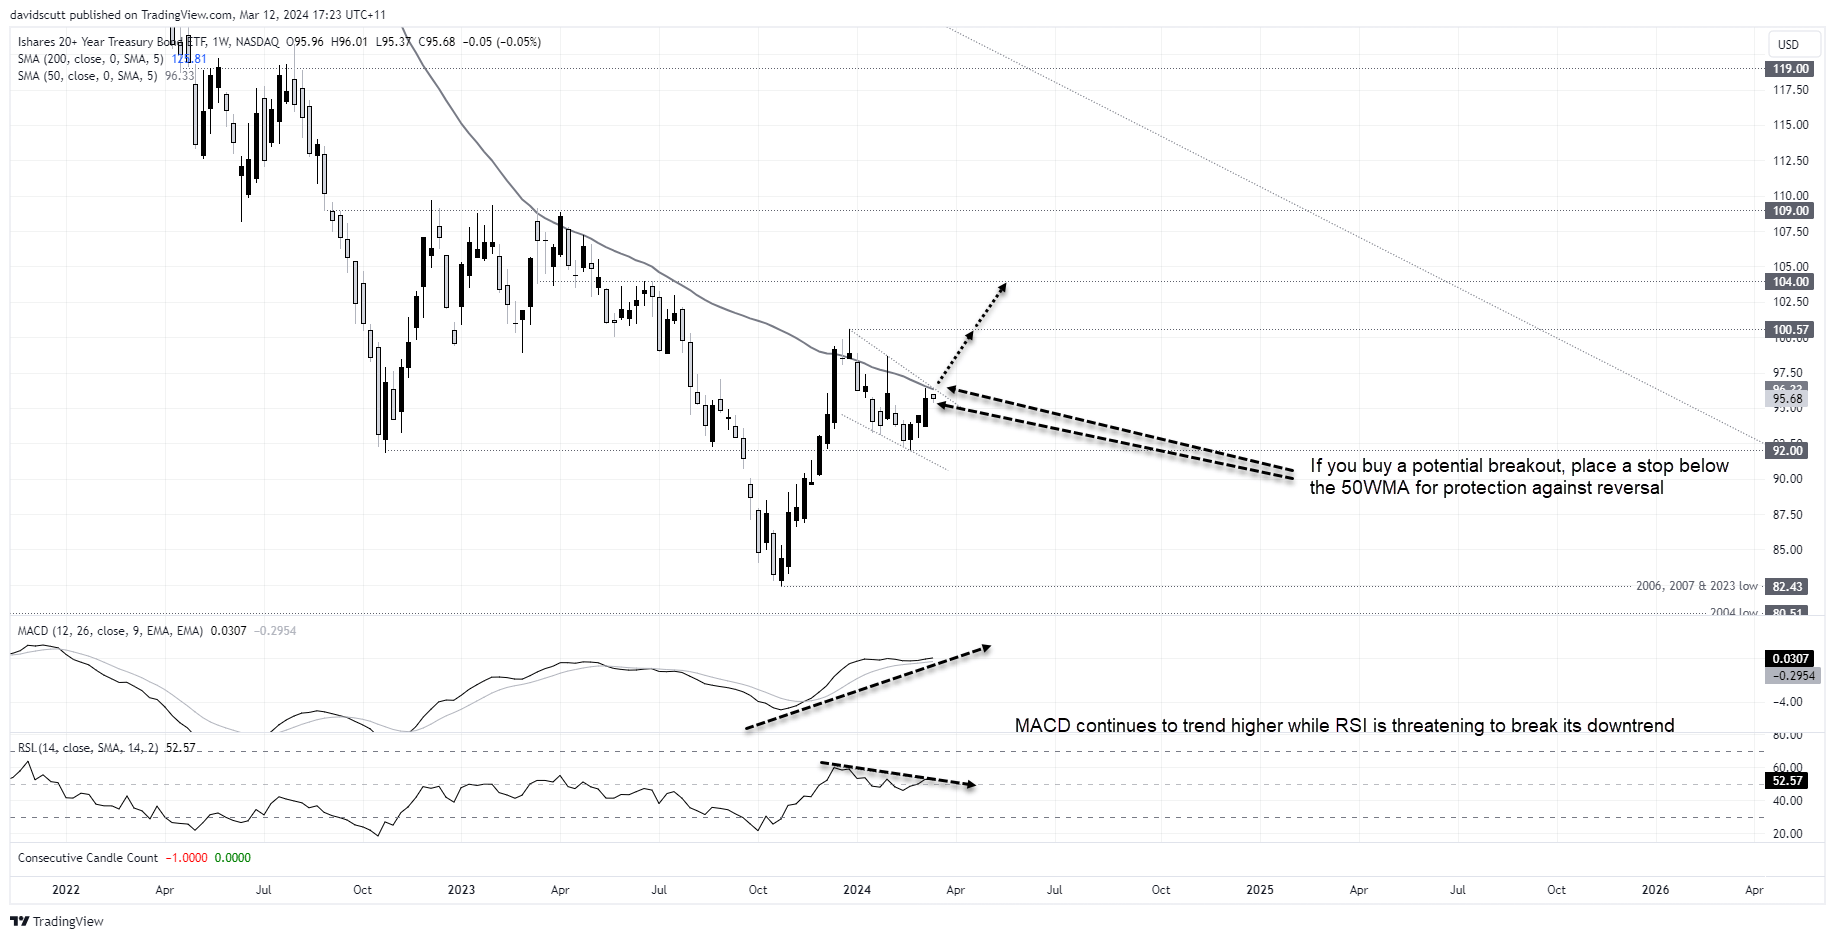
TLT testing 50-week moving average
Looking at the TLT weekly, the price sits at an interesting technical level into what’s arguably the most important US inflation report for almost a year following the hot January result a month ago. After rebounding from what’s now a major triple bottom at $82.43, TLT is now testing the 50-week moving average, a level that has capped advances on multiple occasions since early 2022, including the past few months.
While it’s been unsuccessful thus far, sitting in what looks to be a bullish pennant, it points to the potential for TLT to join other rates indicators in threatening to break higher. A break through the 50-week MA and pennant puts the December 2023 high around $100.57 in sight. A stop loss below the 50-week MA would provide protection against reversal. Beyond, $104.00 would be the next upside target for potential longs.
US CPI a make-or-break moment for long bond bulls
With the February US inflation report carrying the potential to answer whether the hot reading in January was an anomaly or start of a potential trend, we have an obvious catalyst that could make or break the bullish bond breakout trade idea flagged today.
For those considering the trade, please be aware the US Treasury will be auctioning off 10-year notes and 30-year bonds this week, providing other major risk events for longer-dated yields
-- Written by David Scutt
Follow David on Twitter @scutty
How to trade with City Index
You can trade with City Index by following these four easy steps:
-
Open an account, or log in if you’re already a customer
• Open an account in the UK
• Open an account in Australia
• Open an account in Singapore
- Search for the market you want to trade in our award-winning platform
- Choose your position and size, and your stop and limit levels
- Place the trade
Latest market news
Yesterday 01:32 PM
Yesterday 09:35 AM
Yesterday 07:23 AM
Yesterday 04:48 AM
Yesterday 12:17 AM
July 25, 2024 10:39 PM
Latest iShares Barc 20 plus Yr Treasury ETF articles

March 19, 2024 02:30 AM

December 19, 2023 05:47 AM

November 7, 2023 01:53 AM

October 10, 2023 05:56 AM