


US CPI Key Points
- US CPI is expected to hold steady at 3.1% y/y, with the “Core” (ex-food and -energy) reading coming in at 3.7% y/y.
- The ISM PMI surveys suggest that most of the disinflationary pressures may be behind us.
- GBP/USD’s technical outlook remains bullish above 1.2800 with plenty of UK and US data to digest this month.
When is the US CPI Report?
The February US CPI report will be released at 8:30am ET on Tuesday, March 12, 2024.
What Are the US CPI Report Expectations?
Traders and economists expect the US CPI report hold steady at 3.1% y/y on a headline basis, with the “Core” (ex-food and -energy) reading anticipated at 3.7% y/y.
US CPI Forecast
As we noted last month, traders and economists have been expecting a slowdown in job growth and falling inflation to push the Fed to start cutting interest rates, potentially as soon as this month.
Instead, the US labor market remains objectively strong, highlighted by last week’s above-expectations Non-Farm Payroll reading (though negative revisions took some of the sheen off the initial strong numbers), and price pressures have not moderated sufficiently to give the Fed confidence in cutting interest rates, likely until May or June at the earliest.
Tomorrow’s US CPI report is the next big test to see if the trend of US economic exceptionalism in 2024 can extended from here.
Digging into the data, headline CPI has clearly seen its decline stall over the last couple of quarters, with the year-over-year measure actually increasing from 3.0% to 3.1% over the last eight months. That said, the Fed is more concerned with the “Core” CPI reading, which is seen as more indicative of underlying price pressures and has continued to edge lower in recent months and is expected to dip toward 3.7% y/y in this month’s reading.
One of the best leading indicators for inflation is the “Prices” component of the Manufacturing and Non-Manufacturing PMI surveys. Historically, a simple average of these two components has been a relatively reliable predictor of CPI readings 3-6 months into the future, as the chart below shows:
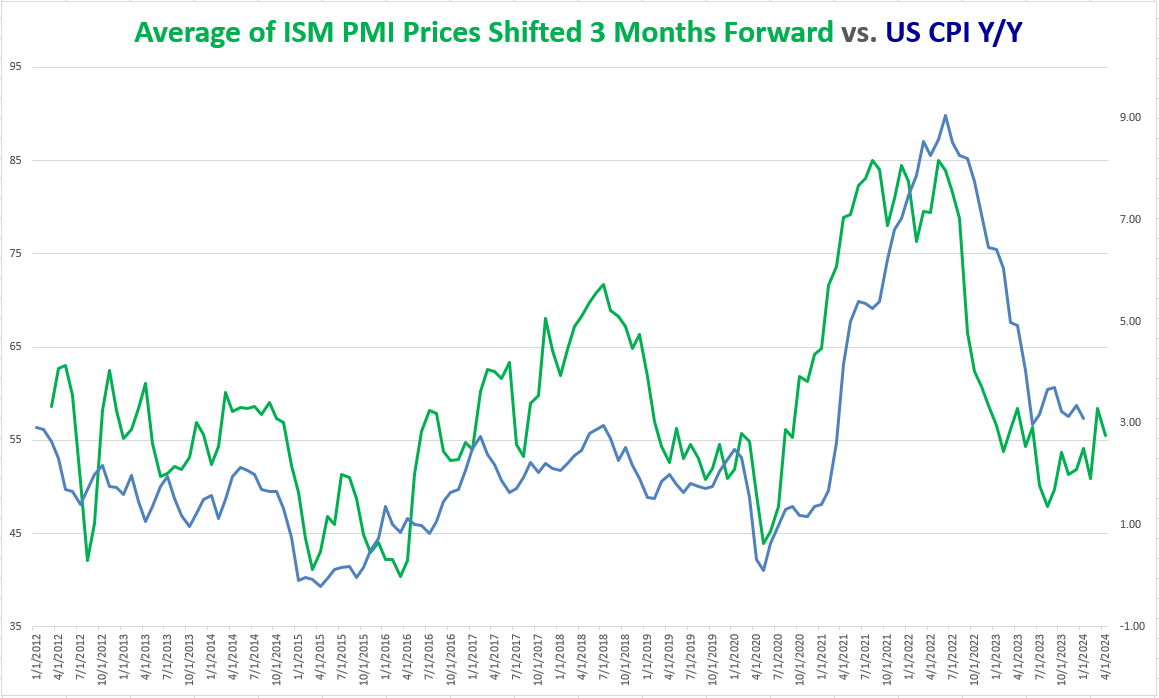
Source: TradingView, StoneX
As the chart above shows, the “Prices” component of the PMI reports has similarly stopped falling after a big spike in 2021 and moderation throughout 2022. Notably, this measure of price pressures bottomed back in Q3 of last year, suggesting that, if anything, headline CPI could tick higher in the coming months depending on base effects.

US Dollar Technical Analysis – GBP/USD Daily Chart
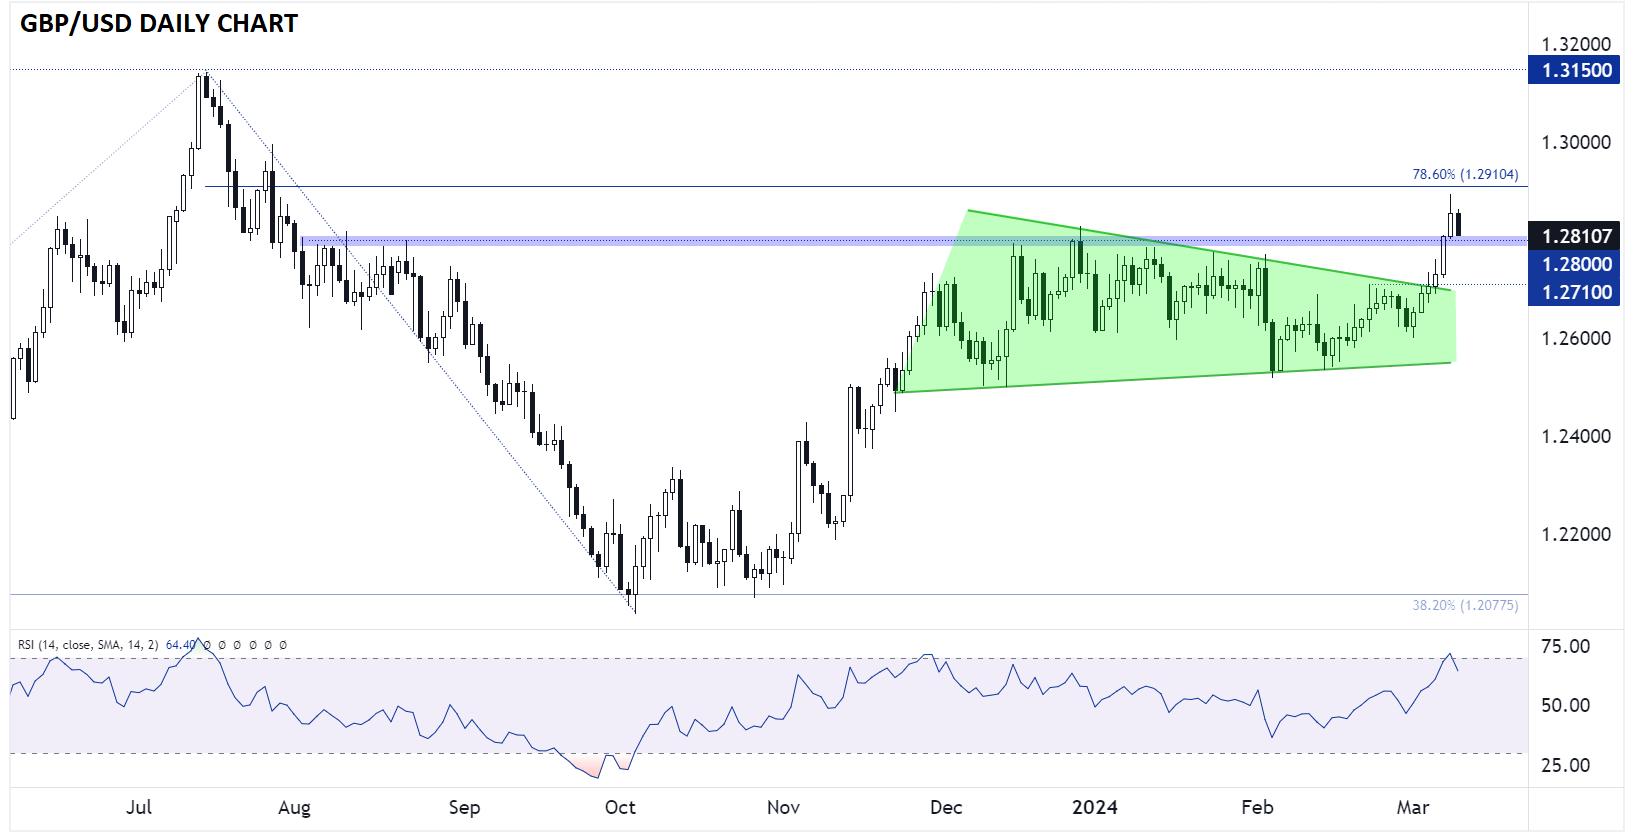
Source: TradingView, StoneX
Turning our attention to markets, GBP/USD is worth watching as a cross where both central banks have pushed back against market expectations for early, and frequent, interest rate cuts this year.
As the chart above shows, GBP/USD broke out of a big symmetrical triangle pattern last week, seeing a strong bullish continuation to trade above former resistance at 1.2800 by Friday’s close. While rates are pulling back to retest that level as of writing, the bigger picture technical outlook for GBP/USD remains bullish as long as the pair holds above 1.2800, with potential for a move toward 1.29 or even 1.30 if we strong UK data (jobs figures tomorrow + GDP on Wednesday) and/or weak US data this week.
-- Written by Matt Weller, Global Head of Research
Follow Matt on Twitter: @MWellerFX
Latest market news
April 25, 2024 03:09 PM
April 25, 2024 03:00 PM
April 25, 2024 01:12 PM
Latest CPI articles
April 12, 2024 03:39 AM

April 10, 2024 01:40 PM

April 5, 2024 04:00 PM

March 17, 2024 08:00 PM