


- The US dollar remained supreme following a hawkish speech from Jerome Powell at the Jackson Hole Symposium.
- Powell warned that interest rates aren’t likely to come down soon, and that a softer labour market will “bring some pain to households and businesses”.
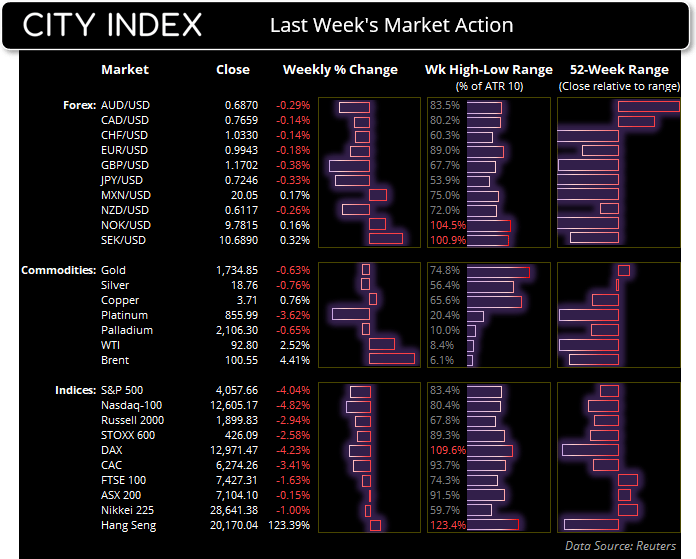
- The combination of a weaker economy and higher interest rates weighed on US equity markets. Wall Street was broadly lower on Friday and more than erased all of Wednesday and Thursday’s gain, closing the week with bearish engulfing candles on the daily chart.
- AUD was the strongest currency last week following news of more stimulus China’s government, although it handed back most of its gains on Friday due to a stronger US dollar. The US dollar rose against all other major currencies, whilst GBP and CHF were the weakest last week.
- Australian retail sales are in focus at 09:30.
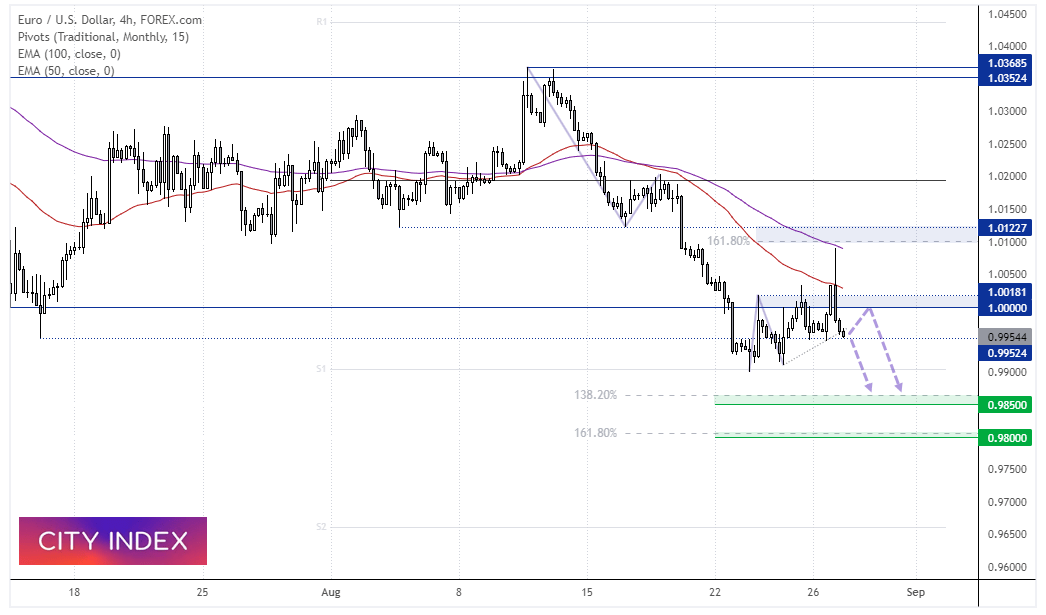
EUR/USD chart:
EUR/USD rose to a 5-day high on Friday, with its rally stopping just shy of the 161.8% Fibonacci projection. Yet the sharp reversal saw the day close with a large bearish Pinbar on the daily chart, which marks a potential swing high just below 1.0100.
The 4-hour chart shows a bearish engulfing (and bearish outside) candle. Prices have just broken beneath trend support and considering a break of the July low (0.9992). The bias remains bearish below the parity resistance zone and for a move down towards the 138.2% and 161.8% Fibonacci projections.
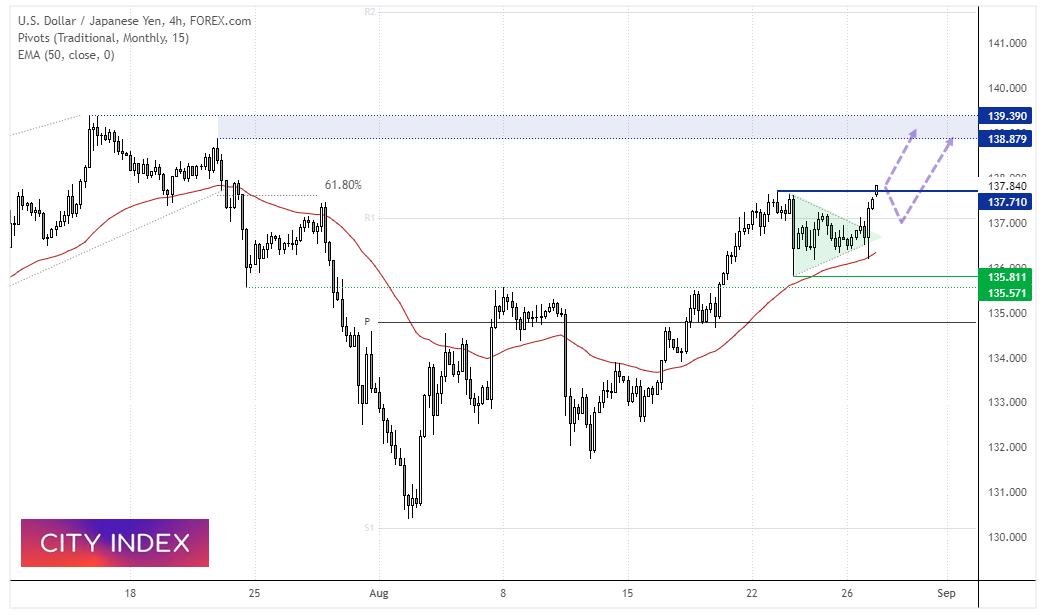
USD/JPY 4-hour chart:
USD/JPY eventually broke higher from the symmetrical triangle we mentioned on Friday, although there was a volatile false break to the downside initially. However, the 50-bar eMA provided support and a bullish engulfing candle then formed. Prices are now trading just above last week’s high, so it appears the bullish trend is set to continue. The next target for bulls to consider is the resistance zone around 139.
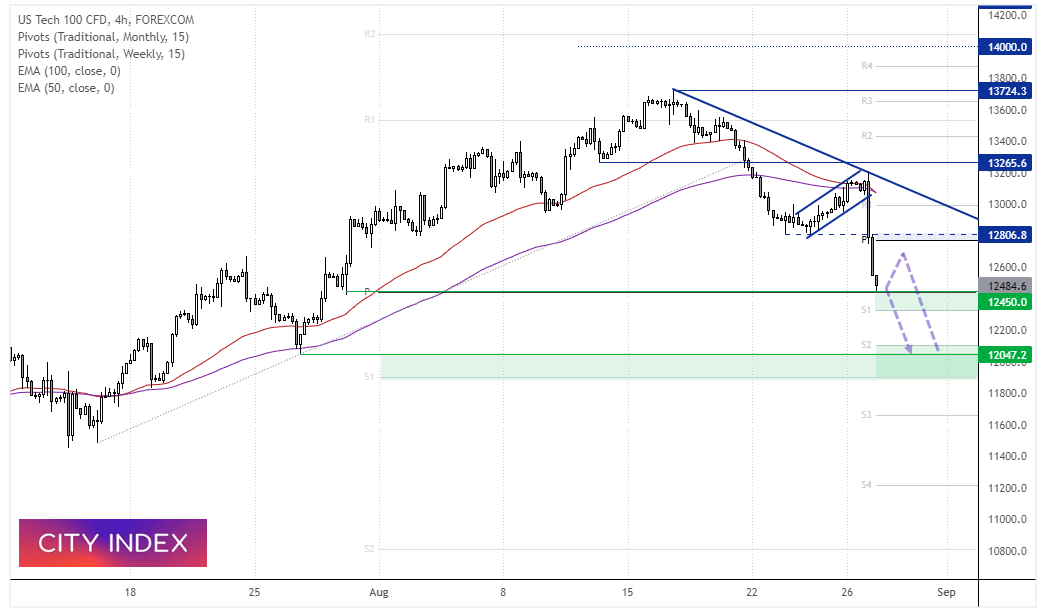
Nasdaq 100 4-hour chart:
Momentum turned sharply lower on Friday for US stocks and formed a bearish engulfing candle on Friday. The Nasdaq 100 opened at the high and closed at the low of the week. And at current levels, the index is on track for a bearish hammer on the monthly chart, with just three trading days left in the month.
The four-hour chart shows that prices broken out of a small corrective channel and respected a bearish trendline. The 50 and 100-bar eMA’s also capped as resistance. Support was found at the monthly pivot point and 12,450 low, and we suspect a period of consolidation or retracement higher is on the cards today before losses resume. The bias remains bearish below 12,800 and for a move down to the 12,000 support zone.
How to trade with City Index
You can easily trade with City Index by using these four easy steps:
-
Open an account, or log in if you’re already a customer
• Open an account in the UK
• Open an account in Australia
• Open an account in Singapore
- Search for the company you want to trade in our award-winning platform
- Choose your position and size, and your stop and limit levels
- Place the trade
Latest market news
Yesterday 01:32 PM
Yesterday 09:35 AM
Yesterday 07:23 AM
Yesterday 04:48 AM
Yesterday 12:17 AM
July 25, 2024 10:39 PM
Latest Technical Analysis articles

July 25, 2024 03:59 PM

July 24, 2024 07:26 PM

July 24, 2024 09:55 AM

July 23, 2024 11:58 AM