


- S&P 500 outlook: Hawkish repricing of rate cuts could undermine overstretched equities
- Fed Governor Chris Waller says 3 rate cuts appropriate (not 6 the markets are after) = potentially bearish news
- S&P 500 technical analysis suggests index is near extremely over stretched levels

Earlier today, things were looking positive for US markets. The tech-fuelled rally resumed on Wall Street following a long weekend break, with the likes of Nvidia surging to new highs, while Tesla looked to end a three-week losing run as it jumped out of the gate at the open. US stock markets were looking impressive, and it looked like new records would be set soon… Only for the Fed’s Chris Waller to ruin the mood, whose hawkish comments caused indices to drop from earlier levels and the dollar found renewed support. Sentiment turned a little sour. The probability of a March rate cut fell to 63% from around 80% at the of last week. If this is a sign that investors are finally realising that the Fed won’t be so aggressive in its rate cuts, then there is a risk we may see a correction in stock markets. However, let’s try not to pre-empt anything, especially now that we have started the earnings season. We will let the markets decide on direction before looking for trades.
So how hawkish was Fed’s Waller?
As hawkish as he could have been. In response, stocks briefly bounced back after comments from the Fed Governor Chris Waller were released, before resuming lower. Overall, he re-iterated the same data-dependent approach and said he believes the FOMC will cut rates. But he said 3 rate cuts would be appropriate, not 6 that were priced in the markets. Lo and behold, up went the dollar, and down went bonds and gold. Stocks rebounded after a brief dipped, before resuming lower again at the time of writing.
Waller said that he is becoming more confident that the Fed is “within striking distance of achieving a sustainable level of 2% PCE inflation.” He added that “as long as inflation doesn’t rebound and stay elevated, I believe the FOMC will be able to lower the target range for the federal funds rate this year.”
But Waller reiterated his support for just three cuts: "This view is consistent with the FOMC's economic projections in December, in which the median projection was three 25-basis-point cuts in 2024".
S&P 500 outlook: Technical levels to watch
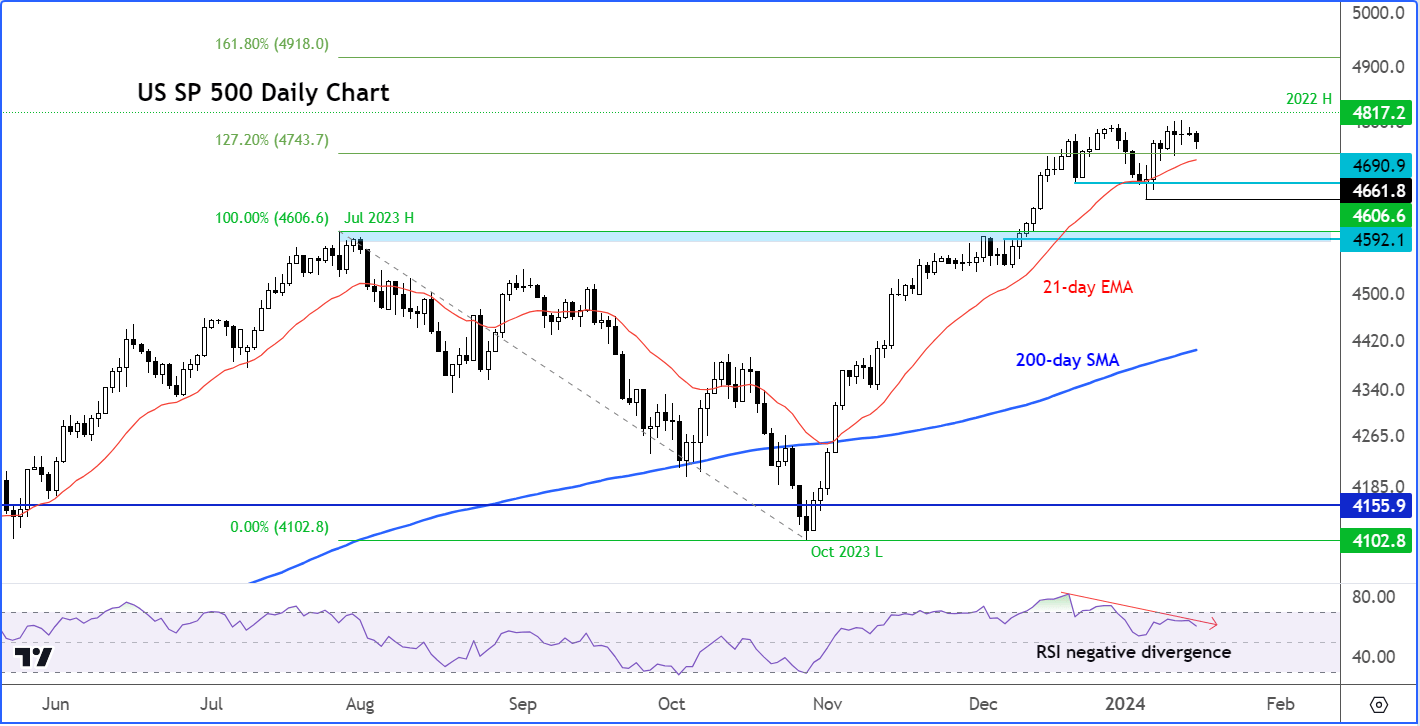
Source: TradingView.com
The S&P 500 was about 0.8% shy of hitting its previous record high set in 2022, at 4817, earlier today. The index hit a low in October, and since then it has staged one of its biggest and fastest rallies ever. By early December, it took out the high from last year, set in July, at 4606, before rising to the 127.2% Fibonacci extension level (4743) of the drop from that July peak. The 161.8% extension of the same swing comes in at 4918. This will be the extended target beyond the 2022 high, should we get there at some point in the future.
Stock market bulls may have overpriced the Fed’s rate cuts and now there might be some necessary adjustments. Indeed, the S&P has diverged from its RSI indicator in recent weeks, at extremely overbought levels. So, a technical correction may be due anyway. The higher highs in the underlying index have not been matched corresponding higher highs on the RSI. This is a potential bearish sign and a warning for the bulls.
However, the bears will need to see a confirmed bearish reversal pattern around these levels before looking to dip their toes in on the short side.
On the downside, short-term support is seen around 4743, followed by 4690 and then that July 2023 high of 4606, which is a massive level of support. So, these could be some of the levels bearish traders might be targeting, in the event we see a reversal.
But needless to say, nearly all other key technical indicators are pointing higher. So, the bears must tread carefully.
-- Written by Fawad Razaqzada, Market Analyst
Follow Fawad on Twitter @Trader_F_R
How to trade with City Index
You can trade with City Index by following these four easy steps:
-
Open an account, or log in if you’re already a customer
• Open an account in the UK
• Open an account in Australia
• Open an account in Singapore
- Search for the company you want to trade in our award-winning platform
- Choose your position and size, and your stop and limit levels
- Place the trade
Latest market news
Yesterday 01:32 PM
Yesterday 09:35 AM
Yesterday 07:23 AM
Yesterday 04:48 AM
Yesterday 12:17 AM
July 25, 2024 10:39 PM
Latest Technical Tuesday articles

July 23, 2024 05:20 PM

July 16, 2024 03:17 PM

May 14, 2024 06:00 PM
April 23, 2024 04:00 PM