


The parabolic SAR is a useful technical tool to get to know, generating endless signals on any market. Learn all about trading with the PSAR here.
- Parabolic SAR explained
- How to read the parabolic SAR
- How to trade with the parabolic SAR
- How to calculate PSAR
- Best parabolic SAR strategy
- PSAR FAQ
Parabolic SAR explained
The parabolic SAR (PSAR) is a trading indicator used in technical analysis. Standing for parabolic stop and reverse, it can help you generate trading signals, plan your exits and more – all using a series of dots that appear above or below the current price action.
The indicator was invented by J. Wells Wilder Jr., the father of many popular technical tools used today: including the RSI, ATR and ADX indicators. It is one of the easier indicators to understand on a trading chart, making it a common choice among beginner technical traders.
How to read the parabolic SAR
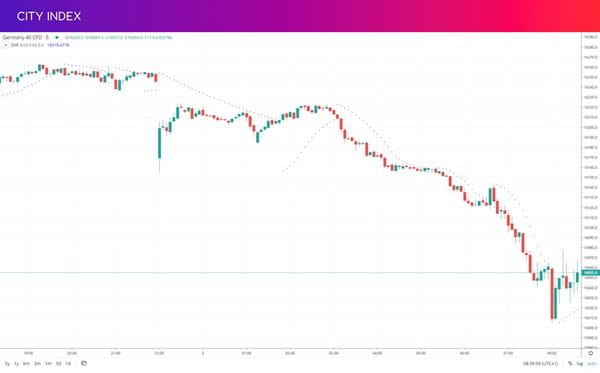
To read the parabolic SAR, you simply look at the dots that it adds to your chart. If they are above the current price, it is a sign of a bearish trend; if they are below, it is a sign of a bullish trend. If the dots switch, then momentum may be reversing.
Generally, the parabolic SAR is best used in highly trending markets. If a market is rangebound, then it can give lots of false signals.
How to trade with the parabolic SAR
The most popular way to trade using the parabolic SAR is to open new positions when the dots cross over the price. If the dots go from above the price to below, you’d look to buy – whereas if they move from below to above, you’d look to sell.
However, as we’ve already seen, the PSAR can be prone to false signals in markets that aren’t strongly trending. Because of this, it’s usually recommended to use the parabolic SAR alongside other momentum indicators. We’ll cover some strategies for this below.
You don’t have to use the parabolic SAR to enter positions, either. Let’s look at how to use the indicator to exit trades and set stop losses.
Exiting trades with PSAR
As you might expect, you use parabolic SAR in the exact opposite way to generate closing signals. If you’re trading an uptrend and the dots switch to above the chart, it might be time to sell. If you’re trading a downtrend and they switch to below, a bull market may be taking over so it’s time to buy and close your position.
To avoid closing out too early, some traders wait for two or three dots before exiting their position.
Setting stop losses with PSAR
You can also set your stop loss at the current PSAR level, to ensure that your position gets closed if the market reverses. The idea here is to move your stop loss with each new session, up or down to the new level of the PSAR dot.
As trends play out, the dot typically gets closer and closer to the current price, before switching to signal the end of the trend. This means that your risk levels will usually get smaller as the trend nears its end.
Start trading with the PSAR
Follow these steps to start using the PSAR indicator with City Index today:
- Open your City Index account, or log in if you already have one
- Add some funds
- Select ‘Parabolic SAR’ on the chart of your chosen market
- Open your buy or sell position
Alternatively, you can practise trading with a cost-free City Index demo account. You’ll get full access to our platform, preloaded with virtual funds. So, you can test out your trading strategy with zero risk.
How to calculate parabolic SAR
To calculate the parabolic SAR, you need to know a few pieces of key information:
- The most recent extreme price (EP). The highest high in an uptrend, or lowest low in a downtrend
- The acceleration factor (AF). This starts at 0.02, and increases by 0.02 each time a new EP is reached
- The previous PSAR figure
With that data in hand, you can calculate the PSAR using one of two formulas, depending on whether the market is trending up or down:
Parabolic SAR formula
Uptrend PSAR = Prior PSAR + (Prior AF (Prior EP - Prior PSAR))
Downtrend PSAR = Prior PSAR – (Prior AF (Prior PSAR - Prior EP))
If the figure crosses the market’s price, then you need to switch to the other formula. Of course, you never actually have to calculate the parabolic SAR manually – the City Index platform will do it for you.
Best parabolic SAR strategy
The best parabolic SAR strategy depends on your own preferences. Most strategies using the parabolic SAR, however, are intended for active styles such as day trading or scalping – the indicator is well suited here because of the regular signals it generates.
In general, a PSAR strategy involves pairing the indicator with one or more other tools to help you confirm that the market is strongly trending. As we’ve already covered, using the parabolic on a non-trending market will usually result in lots of losing trades.
Here are a couple of examples to get you started:
ADX parabolic SAR strategy
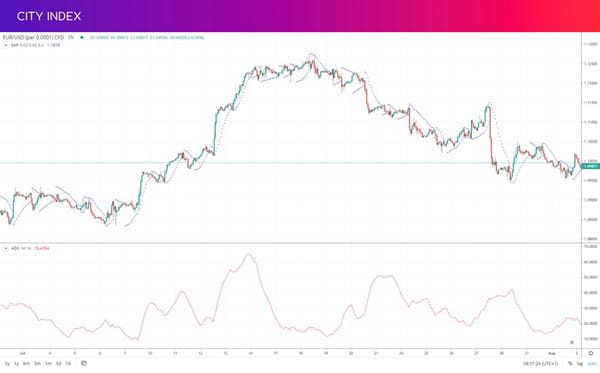
The average directional index (ADX) is another of Wilder’s indicators, and a useful pair for the PSAR because it measures the strength of trends. To follow the ADX parabolic SAR strategy, you:
- Look for markets that are highly trending according to the ADX. This usually means a reading of 25 or higher
- Use the parabolic SAR to judge the direction of the trend, and watch for signals
- Once you’ve found an opportunity, confirm the trend is still strong on the ADX
- Open your position, setting your stop using the PSAR
- Monitor both indicators while your position is open, using the PSAR to move your stop as the trend continues
- Exit the position once the PSAR switches
This strategy can also be employed along roughly similar lines using the RSI or stochastic indicators.
Double parabolic SAR strategy
You don’t necessarily have to use a different tool alongside the PSAR, though. One popular strategy is to use two parabolic SARs at once: one on a longer-term chart, and another on a shorter-term one.
The idea here is to use the longer-term chart to confirm the trend, then trade using the PSAR on the shorter-term timeframe. By checking that the PSAR dots are above or below price action on the longer-term chart, you can ensure that the market is trending, as you would using a different technical indicator.
Parabolic SAR FAQ
Is the parabolic SAR a good indicator?
The parabolic SAR can be a good indicator: it generates lots of signals and has multiple uses. However, it does have numerous limitations. Chiefly, it will always give a buy or sell signal on a market, regardless of what price is doing – so requires a comprehensive plan on which signals to execute and which to ignore.
What’s the best parabolic SAR timeframe?
Most traders use a shorter timeframe to trade with the parabolic SAR, as it is commonly used by day traders and scalpers. However, it is often utilised alongside another PSAR on a longer-term chart, where you can confirm the market’s overall trend.
What are the best parabolic SAR settings?
The best parabolic SAR settings depend on your choice. The most common way of tweaking the parabolic SAR settings is to change the figures on which the acceleration factor (AF) is based. You can change its beginning number, how much it increases by and the maximum it can reach.
To adjust the parameters of the PSAR indicator on the City Index platform, select the settings icon when you hover over or tap the indicator’s name on your chart. Here, you can change the calculation for the acceleration factor (AF).
Latest market news
Yesterday 01:32 PM
Yesterday 09:35 AM
Yesterday 07:23 AM
Yesterday 04:48 AM
Yesterday 12:17 AM
July 25, 2024 10:39 PM
Latest Technical Analysis articles

July 25, 2024 03:59 PM

July 24, 2024 07:26 PM

July 24, 2024 09:55 AM

July 23, 2024 11:58 AM