


Market Summary:
- Market volatility was its typically low for a long weekend in the US and lack of news flow, but with traders set to return to their desks today then perhaps volatility can now expand as the week progresses
- With US cash markets closed, European bourses struggled to gain any real momentum although the FTSE 100 tapped a 6-week high whilst the DAX performed a low-volatility down day after it reversed from its record high on Friday
- S&P 500 E-mini futures ticked higher on Monday although take note of the daily reversal patterns near its record high (dark cloud cover, bearish pinbar) which warn of a minor pullback
- The key technical take for USD pairs is that the US dollar rally looks set for a retracement lower on the weekly charts, but first the daily charts show the potential for a minor rebound higher
- The US dollar index formed a small Rikshaw man doji above 104, EUR/USD formed a small doji below 1.08, GBP/USD closed flat with a Rikshaw man doji after its high met resistance at the 50-day EMA, USD/JPY is coiling up on the daily chart above 150 – which implies volatility could return (although the breakout’s direction is yet to be revealed)
- NZD/USD offered the most excitement among FX majors, rising for a fourth day and closing about its 50-day EMA, yet elsewhere ranges were very small.
- New Zealand’s services PMI expanded at its fastest pace in eight months, and ANZ now expect the Kiwi dollar to rise steadily though the year (the local bank who recently upwardly revised their RBNZ forecast to 2x 25 RBNZ hikes)
- The US dollar is curling higher on the 4-hour chart against CAD, CHF and JPY whilst AUD/USD and NZD/USD are near cycle highs, hinting at a pullback for the antipodean pairs
- Gold rose for a third day yet met resistance at the 50-day EMA and formed a small shooting star candle, to warn of a pause or retracement lower from $2020

Events in focus (AEDT):
- 11:30 – RBA meeting minutes
- 18:00 – PBOC loan prime rate (1 and 5-year)
- 21:15 – BOE Bailey speaks
- 00:30 – Canadian inflation report
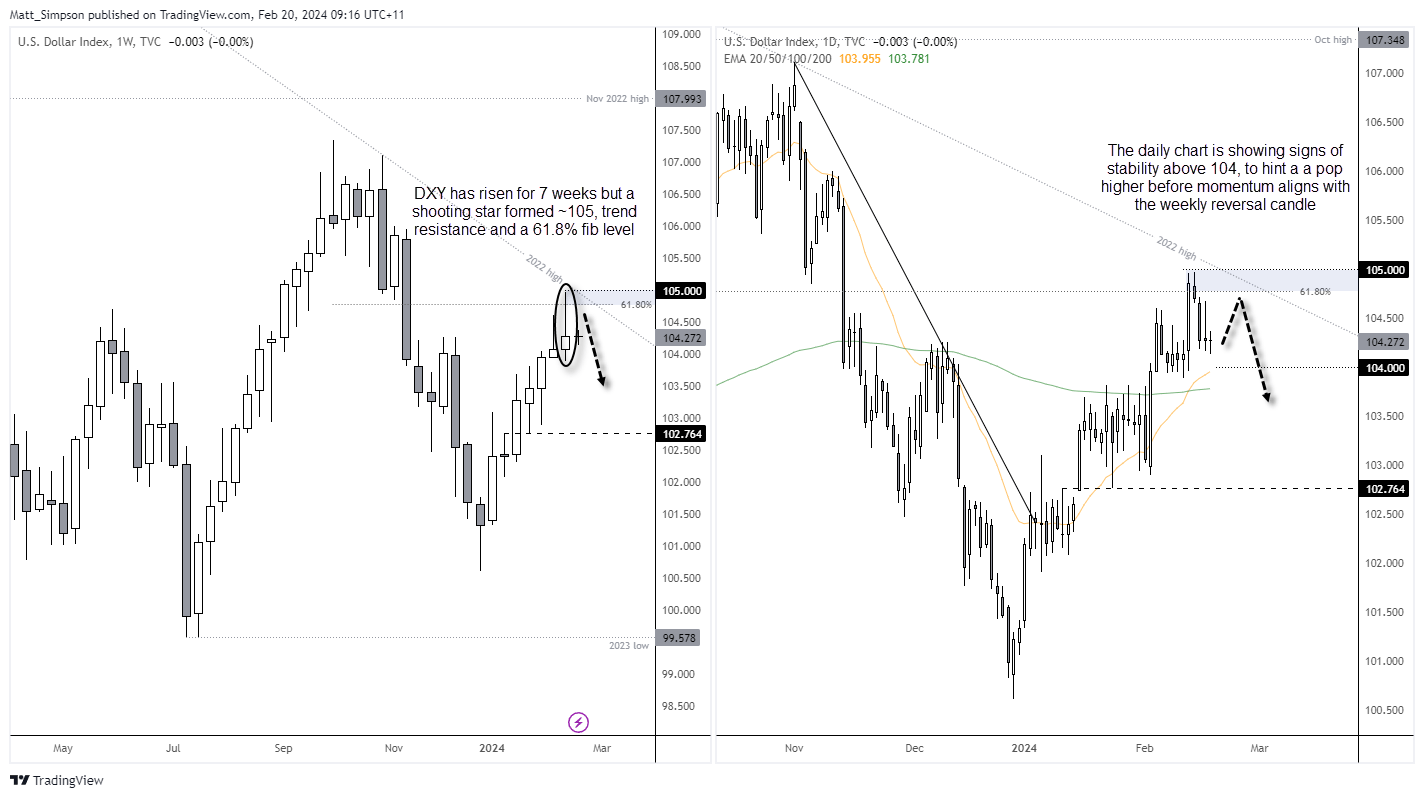
US dollar index technical analysis:
The US dollar index has risen over the past seven weeks mostly in a straight line. Yet it formed a shooting star reversal candle around the 105 handle, trend resistance and the 61.8% Fibonacci level. A pullback on the weekly chart does not seem impossible, although the daily chart hints at a bounce first. Prices are holding above the 104 handle and 10-day EMA, and a small doji formed on Monday. Traders should be on guard for little spikes of volatility either side of Monday's range as traders return, but the bias is for a minor bounce before momentum turns lower. If so, that could see AUD/USD retrace lower from its 4-day rally.
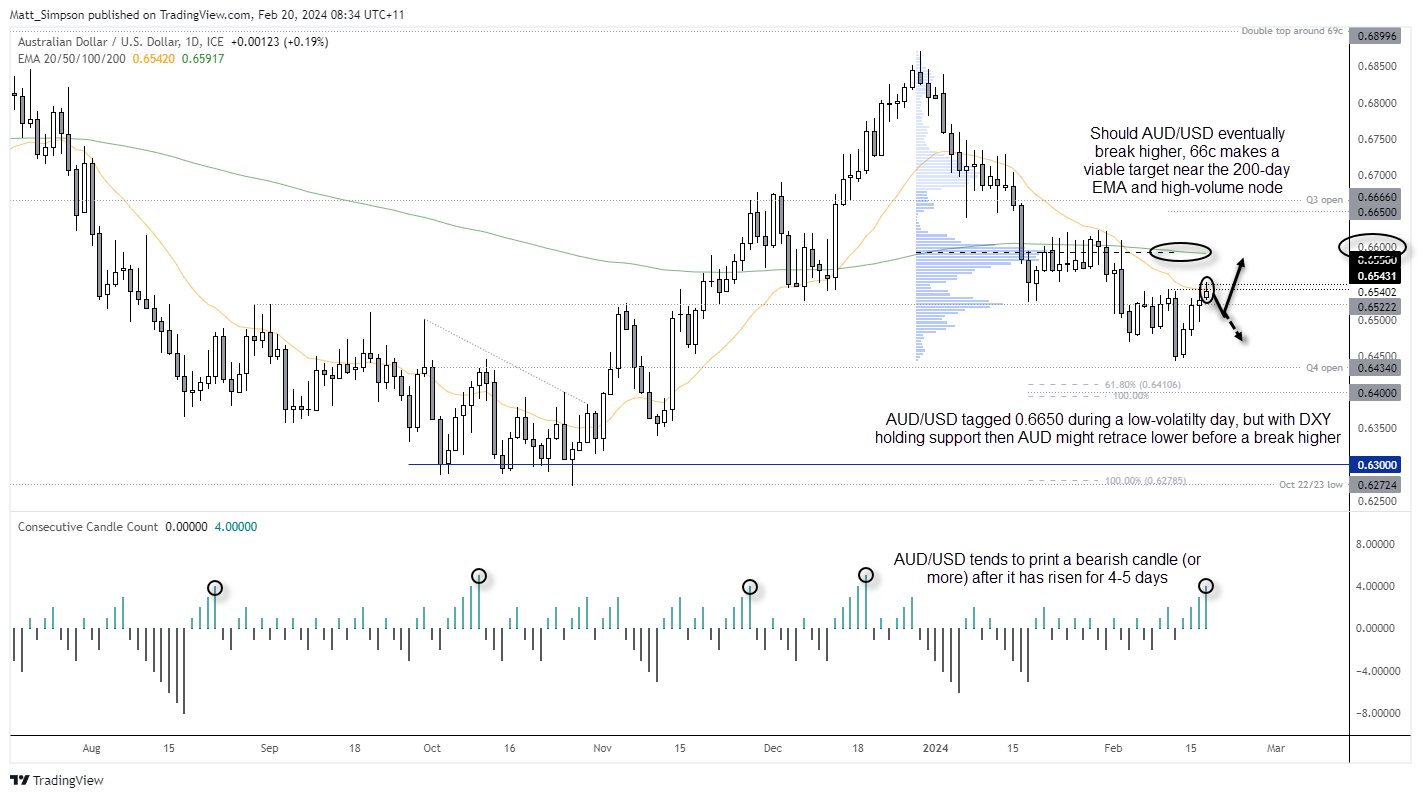
AUD/USD technical analysis (daily chart):
The Australian dollar rose for a fourth day on Monday, which suggests the bullish sequence may be vulnerable to a bearish candle or two appearing. Monday’s small-ranged candle tagged but failed to close above 0.6550 resistance, and looks set to close around its 10-day EMA as part of a small inverted hammer.
Given the two bullish pinbars on the weekly chart, I suspect AUD/USD is building up to a break higher. And that could eventually see it reach for the 66c handle near the 200-day EMA and high-volume node from the prior decline. But that fact that the US dollar index is holding above 104 and looks set for at least a minor bounce suggest AUD/USD may retrace lower form current levels before making a break above Monday’s high.
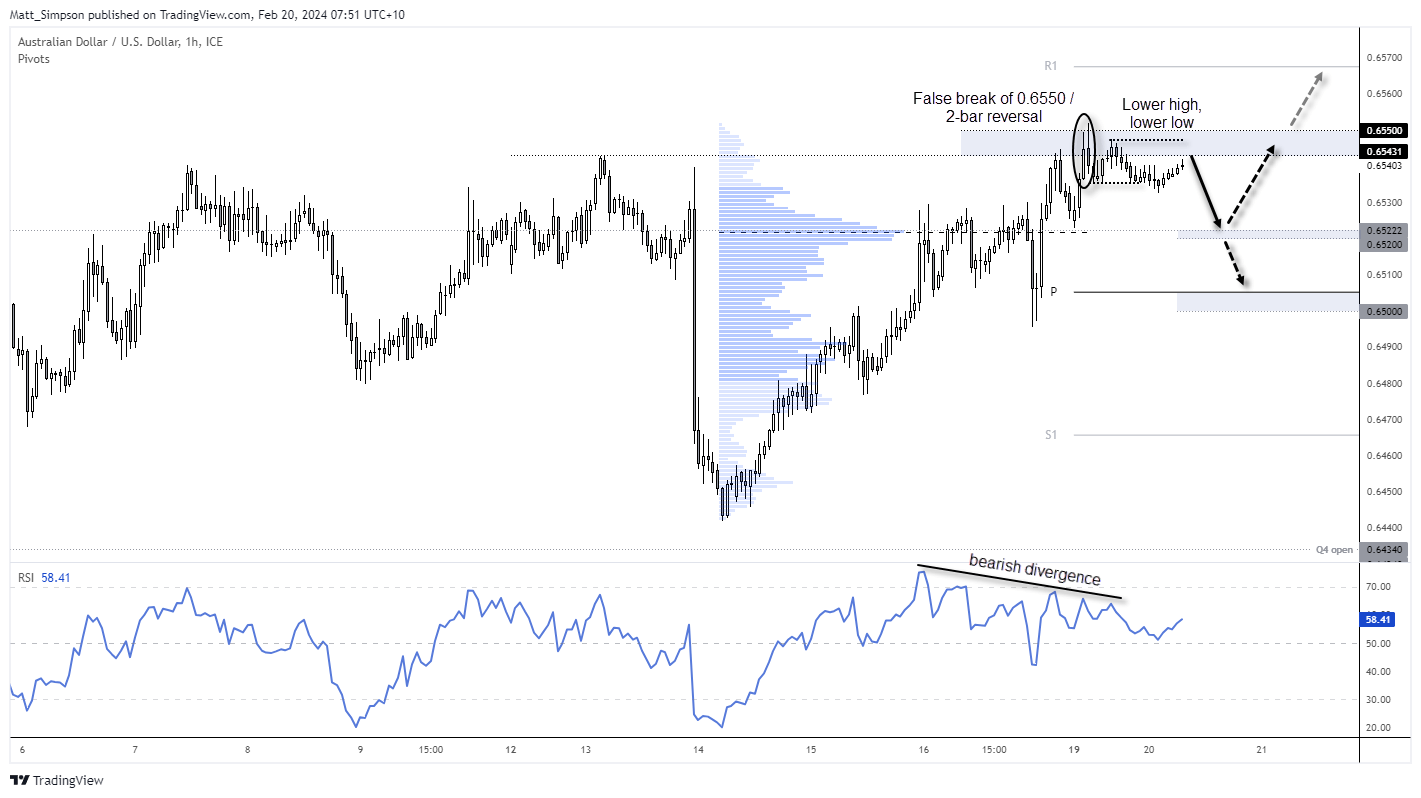
AUD/USD technical analysis (1-hour chart):
An uptrend has formed on the hourly chart of AUD/USD, although a false break of 0.6550, 2-bar reversal and subsequent lower high and lower low off the higher warns of a potential retracement lower. A bearish divergence also formed with the RSI (14) to show the bullish trend is losing momentum.
My bias is for a retracement lower towards 0.6520/20 near the high-volume node of the uptrend. A break lower brings the weekly pivot into focus near the 0.6500 handle.
View the full economic calendar
-- Written by Matt Simpson
Follow Matt on Twitter @cLeverEdge
How to trade with City Index
You can trade with City Index by following these four easy steps:
-
Open an account, or log in if you’re already a customer
• Open an account in the UK
• Open an account in Australia
• Open an account in Singapore
- Search for the market you want to trade in our award-winning platform
- Choose your position and size, and your stop and limit levels
- Place the trade
Latest market news
Yesterday 01:32 PM
Yesterday 09:35 AM
Yesterday 07:23 AM
Yesterday 04:48 AM
Yesterday 12:17 AM
July 25, 2024 10:39 PM
Latest Asian Open articles

July 25, 2024 10:39 PM

July 24, 2024 10:10 PM

July 23, 2024 11:29 PM

July 22, 2024 10:43 PM