


Whilst the RBNZ were expected to hold, their statement struck a hawkish tone by stating that “inflation remains too high”. And with traders front-loading a weak CPI print for the US later this week it has catapulted the New Zealand dollar higher.
The consensus was firmly behind the RBNZ to hold their cash rate at 5.5% and for the meeting to be a non event. Yet the opening paragraph was quick to tip its hat to inflation remaining “too high”. And the speed at which NZD was catapulted to the top of the board shows that traders were ‘caught short’ and on the wrong side of the market.
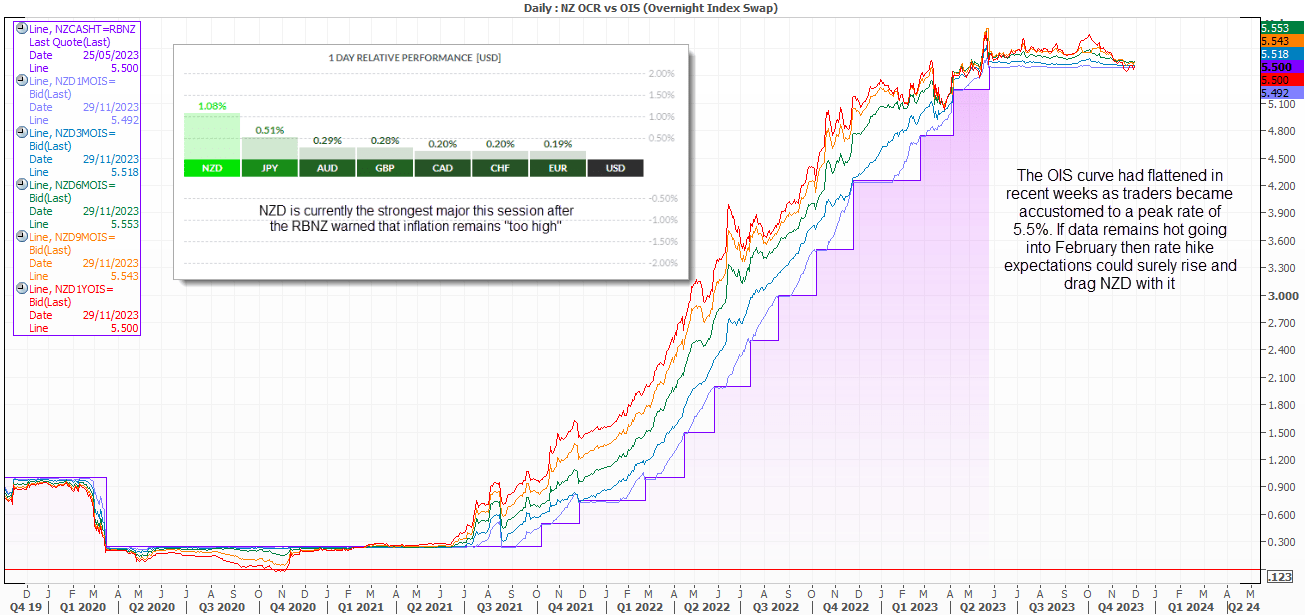
In recent weeks, we have seen the 1-year OIS fall from 5.85% to around 5.5%, as a peak rate was assumed to be a given. However, the RBNZ is not one to mince its words when it comes to monetary policy, and it is not one to shy away from a hike or bow down to political pressures, unlike one of its key trading partners may have done over the years. So, if economic data picks up heading into the February meeting, then hike expectations will surely rise and take NZD higher with it.
NZD/USD technical analysis:
However, I am conscious that we’re heading towards a key US inflation report and that NZD has already had a strong run. Bets are being placed against the US dollar on the assumption of a soft inflation print, but what if these traders assume wrong? This could leave the US dollar to a bout of strength near the end of the weak if US inflation comes in hot. And that could knock a dent in sentiment and weigh on risk assets such as indices, AUD and NZD.
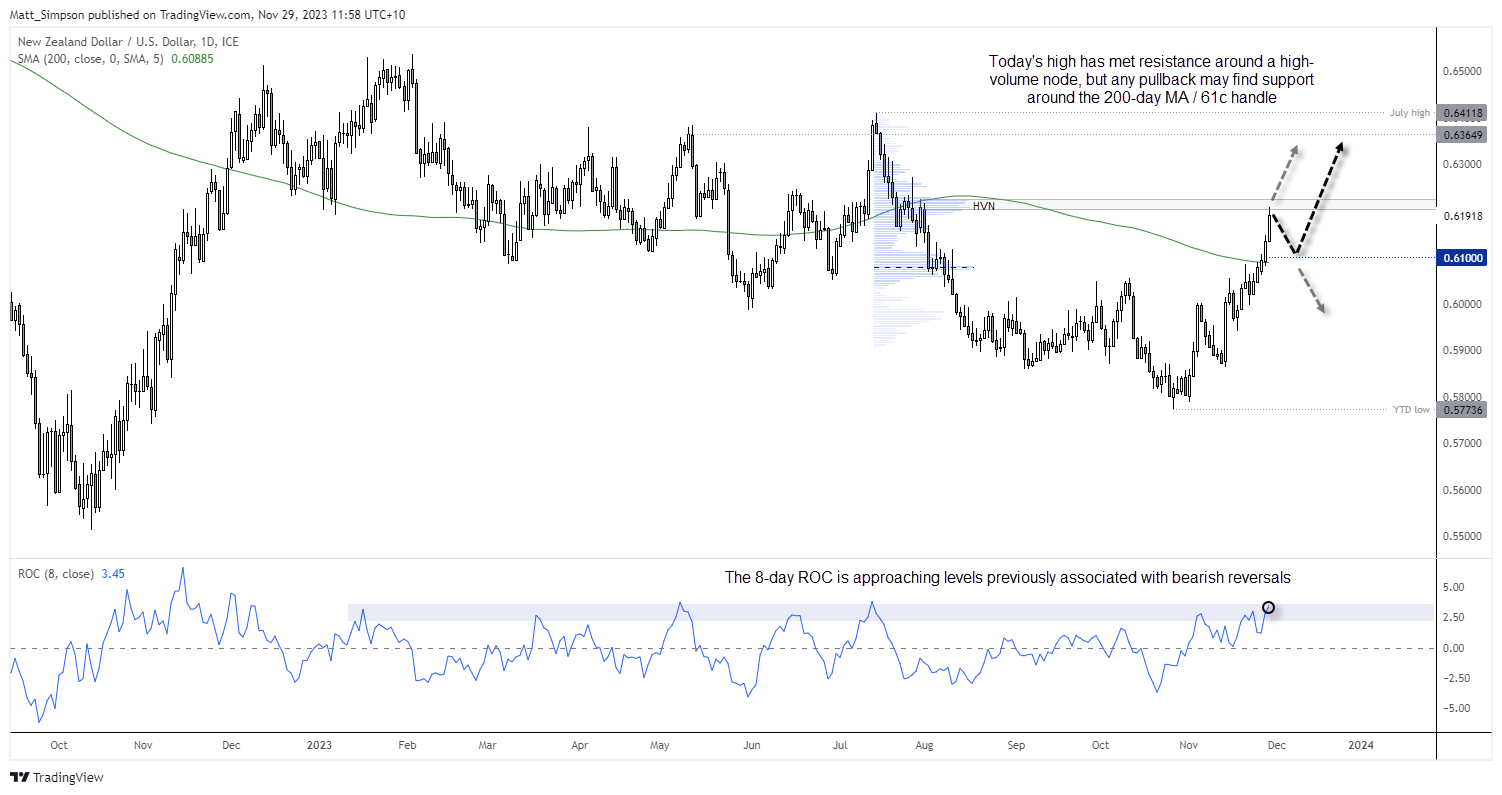
Furthermore, today’s high has stalled near a HVN (high volume node) from the prior decline, and the 8-day ROC (rate of change) is approaching levels usually associated with turning points. Therefore I would be cautious at these highs if bullish as we have surely seen the bulk of the move, and that could leave NZD/USD vulnerable to a retracement should towards its 200-day average / 61c handle ahead of its next leg higher.
AUD/NZD technical analysis (daily chart):
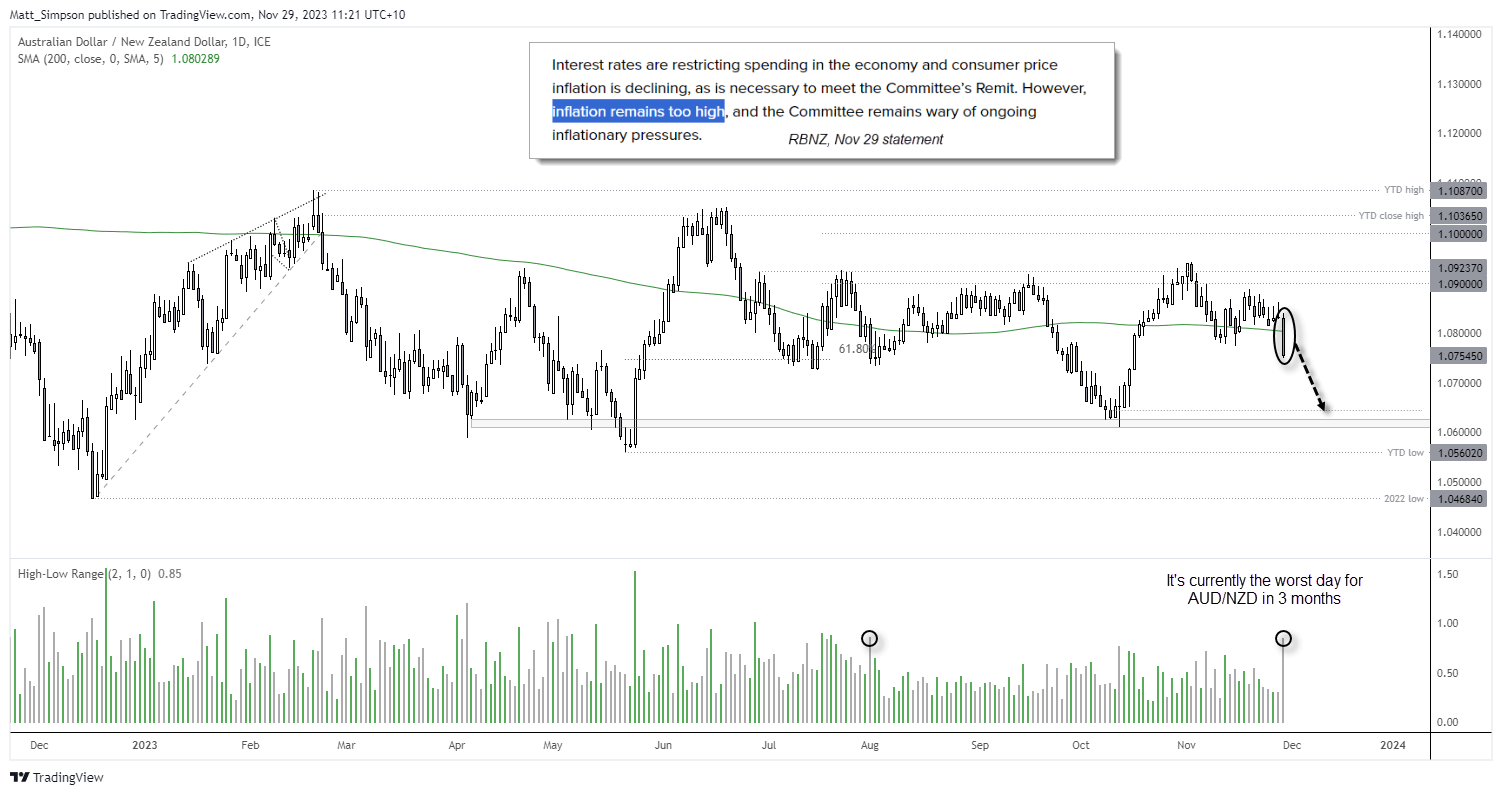
The combination of a soft Australian inflation report and hawkish RBNZ tone saw AUD/NZD cut through its 200-day average like knife through butter. Currently ~0.8% lower on the day, it is its worst day in over three months and shows the potential to extend its decline over the coming week/s.
The daily chart shows that the cross has carved out several sideways ranges this year, with the bulk of recent action being confined the 1.06 – 1.09 range. And as we saw a false break above 1.09 at the beginning of the month followed by a lower high and break beneath its 200-day average, I suspect a move back down to the 1.06 range lows could now be on the cards.
View the full economic calendar
-- Written by Matt Simpson
Follow Matt on Twitter @cLeverEdge
How to trade with City Index
You can trade with City Index by following these four easy steps:
-
Open an account, or log in if you’re already a customer
• Open an account in the UK
• Open an account in Australia
• Open an account in Singapore
- Search for the market you want to trade in our award-winning platform
- Choose your position and size, and your stop and limit levels
- Place the trade
Latest market news
Yesterday 01:32 PM
Yesterday 09:35 AM
Yesterday 07:23 AM
Yesterday 04:48 AM
Yesterday 12:17 AM
July 25, 2024 10:39 PM
Latest Asian Open articles

July 25, 2024 10:39 PM

July 24, 2024 10:10 PM

July 23, 2024 11:29 PM

July 22, 2024 10:43 PM