


February 3, 2023 3:55 PM

Wow! January’s Non-Farm Payroll report blew estimates out of the water! The headline print was 517,000 vs an expectation of only 185,000 and a higher revised December print from 223,000 to 260,000. This was the most jobs added to the economy since July 2022. November’s print was also revised higher. In addition, the Unemployment Rate fell to 3.4% vs an expectation of 3.6% and a December reading of 3.5%. This was the lowest print since May 1969! The Fed will be happy to see that Average Hourly Earnings fell to 0.3% MoM, in-line with expectations and lower than the 0.4% MoM print in December and the 0.6% MoM print in November.
There is a debate in the market as to if the headline print of 517,000 is comparable to the previous month’s numbers. Some economists argued before the release that there could be a big discrepancy between estimates and the actual due to methodology changes and weather effects. However, I don’t think anyone believed the difference would be this wide. Even if one subtracted 200,000 jobs off the print it would be much stronger than expected. So, although this print may be considered too high, it’s probably still a good beat, nonetheless.
USD/JPY jumped 300 pips off the lows after a combination of both the stronger jobs report and the stronger ISM Non-Manufacturing PMI report.
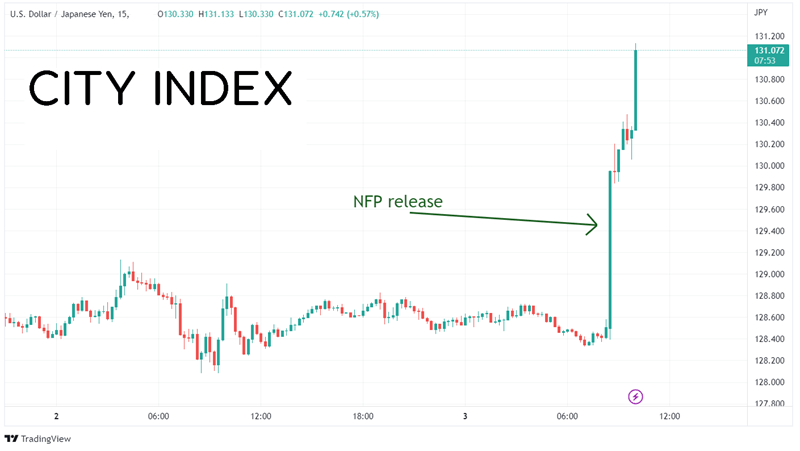
Source: Tradingview, Stone X
Trade USD/JPY now: Login or Open a new account!
• Open an account in the UK
• Open an account in Australia
• Open an account in Singapore
On the daily timeframe, USD/JPY has been moving lower in an orderly channel formation since making 20-year highs in October 2022 at 151.95. More recently, the pair was halted at the 61.8% Fibonacci retracement level from the lows of 2022 to the highs of 2022 near 128.17. USD/JPY traded in a sideways range between 127.22 and 131.57 since January 18th, while moving outside the channel. Despite the large move in the pair today, it is still trading within the range.
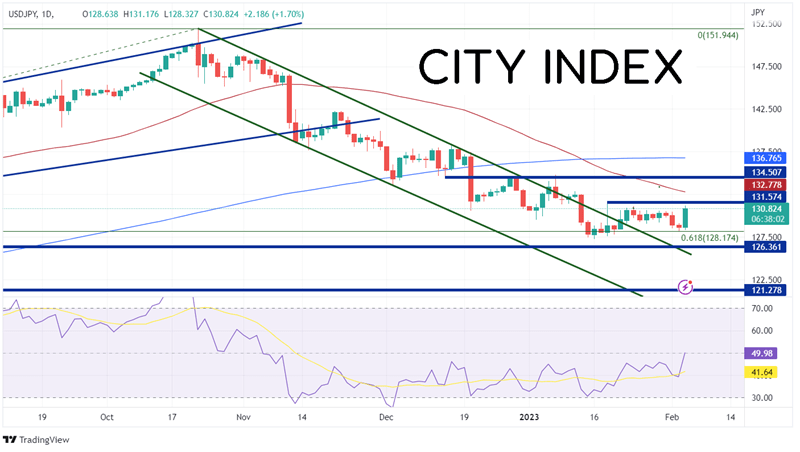
Source: Tradingview, Stone X
However, on a 240-minute chart, USD/JPY had been forming a tighter downward sloping channel of its own. Today, after the release of the NFP data, the pair broke higher above the top trendline of the channel near 130.00. The first level of resistance is at the highs of January 17th near 131.57. Above there, the pair can move to the 50 Day Moving Average at 132.78 (see daily) and then the January 6th highs at 134.77. However, if the move is considered “overbought” and sellers enter the market, USD/JPY could move lower. First support is at the previously mentioned trendline near 130.00, then the lows from February 2nd at 128.02. Below there, price can fall to the Year to Date lows on January 6th at 127.22.
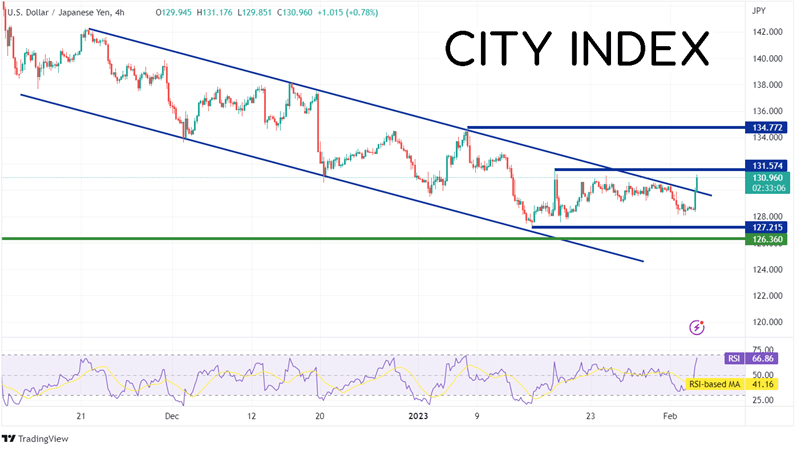
Source: Tradingview, Stone X
The jobs report blew away expectations. Despite any change to the methodology in calculating the data, it is probably still stronger than expected. Will USD/JPY continue to move higher? The first thing the pair has to do is break out of the range that the pair has been in for the last few weeks. After that, it could be off to the races.
Learn more about forex trading opportunities.
Latest market news
Yesterday 01:32 PM
Yesterday 09:35 AM
Yesterday 07:23 AM
Yesterday 04:48 AM
Yesterday 12:17 AM
July 25, 2024 10:39 PM
Latest Forex articles

Yesterday 12:17 AM

July 25, 2024 10:39 PM

July 25, 2024 03:59 PM

July 25, 2024 04:37 AM