


Nasdaq reaches new record high, a week ahead of FOMC: The Week Ahead
Love it or loathe it, the rally on US indices has been impressive. Traders seem to be focussed on lower yields, slightly reduced bets of multiple Fed cuts and any other morsel of what can be repackaged as ‘good news’. But can it withstand incoming GDP figures, a PCE inflation report and an FOMC meeting without a wobble?
The week that was:
- PMI data generally surprised to the upside, with US manufacturing expanding for the first month in 7 and hitting a 15-month high.
- Wall indices continued to push the S&P 500, Nasdaq and Dow Jones to record highs in the first half of the week thanks to positive earnings and the ‘no landing’ theme
- Wall Street indices reached fresh record highs at the beginning of the week, although their lack of volatility raised flags that the rally was running out of steam
- China announced further stimulus to support the stock market and a cut to their RRR to free up long-term liquidity within the financial system. The latter seemed to be the catalyst which finally saw China’s indices rally aggressively from their lows.
- Japan’s exports surprised to the upside to show growing global demand, particularly from the US
- The BOC held interest rates at 5% for a fourth month, but warned of risks to underlying inflation and pushed back on rate cuts saying it was “premature” to discuss them
- The BOJ held policy unchanged and lowered their FY 2024 CPI target, which further signals the BOJ’s reluctance to dismantle Kuroda’s ultra-dovish stance to hammer home the likelihood of no changes

Nasdaq 100 technical analysis: Daily chart
The trend structure on the Nasdaq’s daily chart is obviously bullish with the classic moving averages fanning out to show increasingly bullish momentum across several timeframes. We’re not really seeing volumes diminish, which suggests the rally could still have legs. Although the RSI (14) is overbought once more and providing a very slight bearish divergence. Perhaps the most ominous sign us Wednesday’s candle which gapped higher at the open, and failed to hold onto gains above 17,500 before closing beneath the open price with a shooting star.
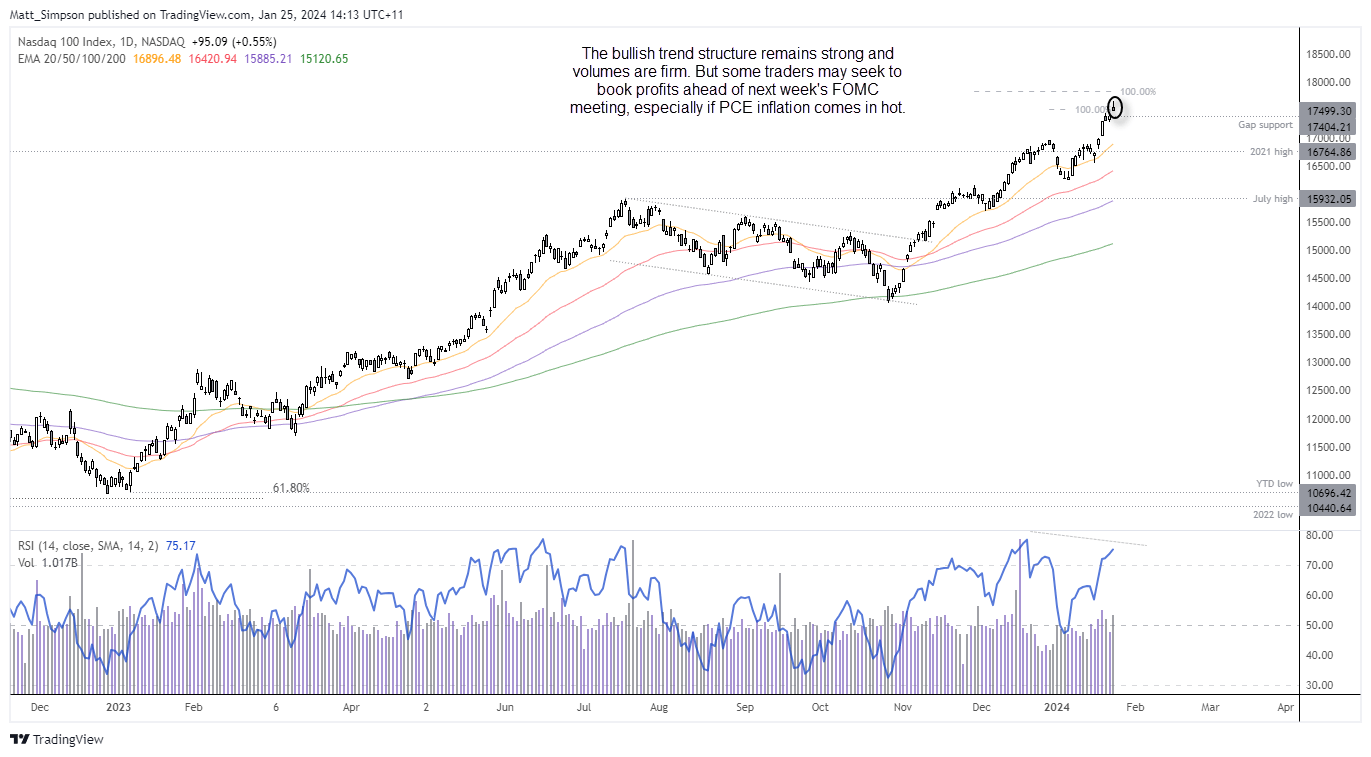
Should sentiment sour ahead of the open and force the Nasdaq to gap lower, it would form a bearish warning pattern called an Island Reversal. But the bearish opening gap cannot be filled and the open price should be around the high of the day for it to be a true island gap. And if sentiment remains supported, we may find the market simply retraces towards Tuesday’s close price to ‘fill the gap and revert higher.
However, keep in mind that US GDP is released today and a key PCE inflation report tomorrow. And as we have an FOMC meeting next Wednesday, I feel inclined to bet that some traders will want to book profits ahead of it. And that risks some choppy trade around the highs, if not an actual retracement. Should we get a hot inflation report and hawkish hold, then may it can actually enter a correction. But I’ll believe it when I see it.
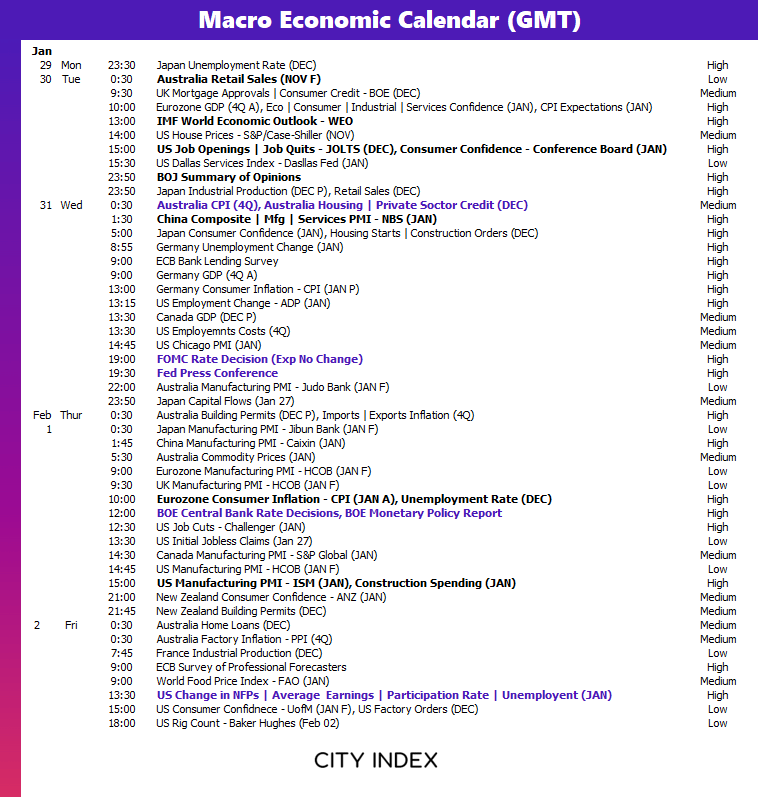
The week ahead (calendar):
The week ahead (key events and themes):
- FOMC interest rate decision and press conference
- Nonfarm payroll report for the US
- BOE interest rate decision
- ISM manufacturing PMI for the US
- Quarterly CPI report for Australia
- IMF world economic outlook
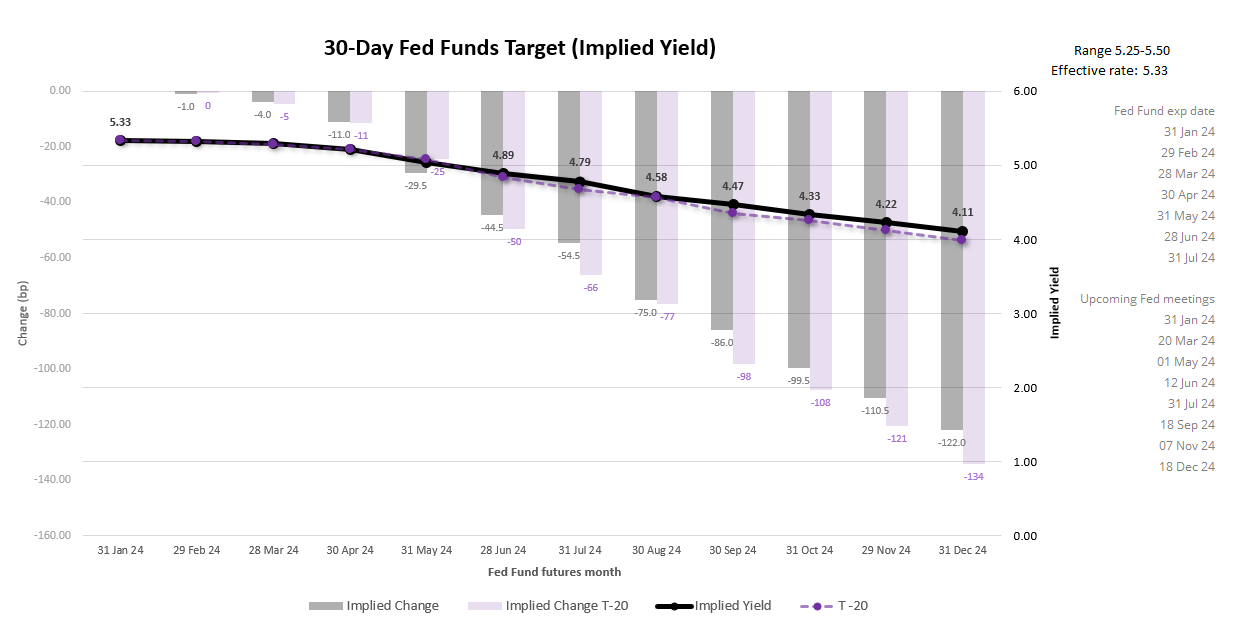
FOMC interest rate decision and press conference
Even though the vast majority agree that the Fed will not change policy next week, it is still the biggest event on the calendar. Fed Fund futures imply ~98% chance of a hold on Wednesday, or a 5*% chance of a hold in March. And whilst that the implied yield curve is less dovish than it was 20 days ago, it still suggests -122 bp of cuts by December which is nearly five full 25bp cuts.
As always, traders will focus on the statement and press conference for any clues for the potential to cut. But if recent comments form Fed officials are anything to go by, it would come as quite a surprise if they delivered a dovish twist in their communications next week. And that means traders will be quick to shift their focus to the subsequent ISM manufacturing and Nonfarm payrolls report.
Trader’s watchlist: EURUSD, USD/JPY, WTI Crude Oil, Gold, S&P 500, Nasdaq 100, Dow Jones
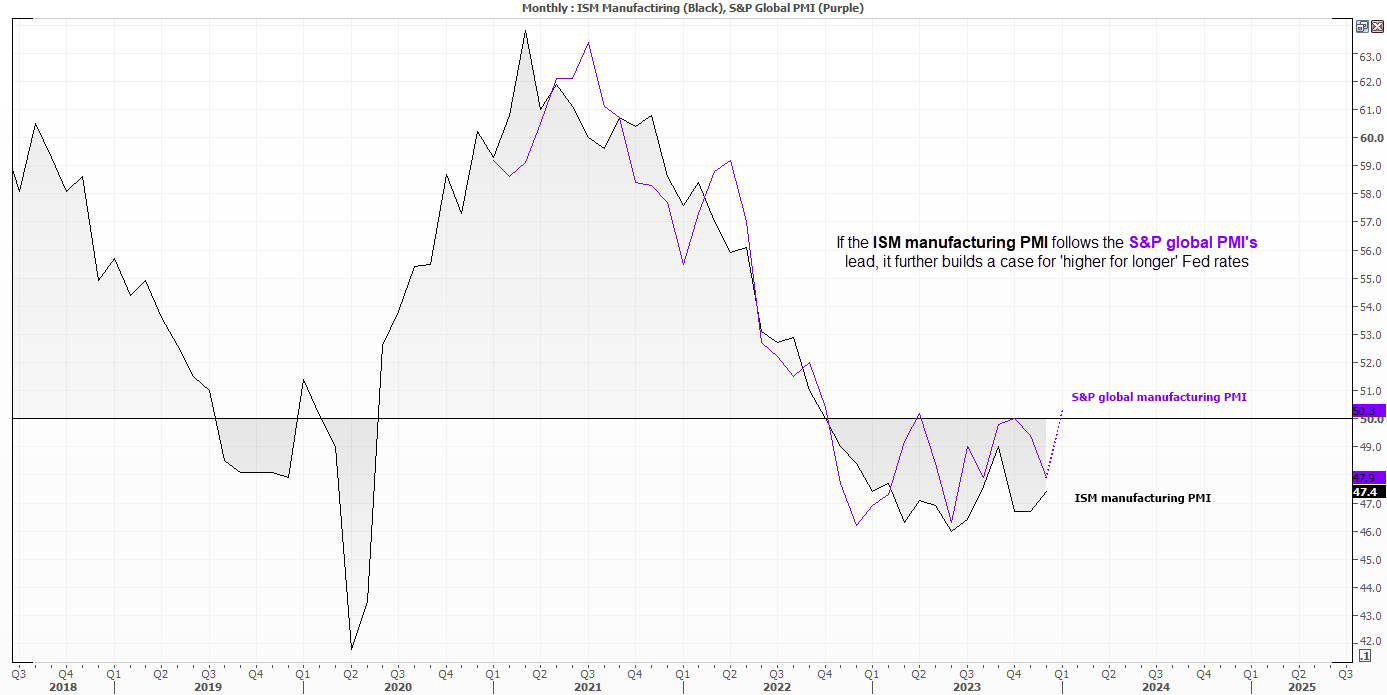
ISM manufacturing PMI for the US
The S&P global flash manufacturing PMI survey estimated the industry to have expanded in January. And it could carry more weight if long-standing ISM manufacturing survey followed suit. The ISM appears to have troughed in June yet remains firmly in contraction levels at 47.4, but if it were to contract at a much slower pace of surprise with an expansion (above 50) then it could spur another round of short-covering for the US dollar.
Trader’s watchlist: EURUSD, USD/JPY, WTI Crude Oil, Gold, S&P 500, Nasdaq 100, Dow Jones
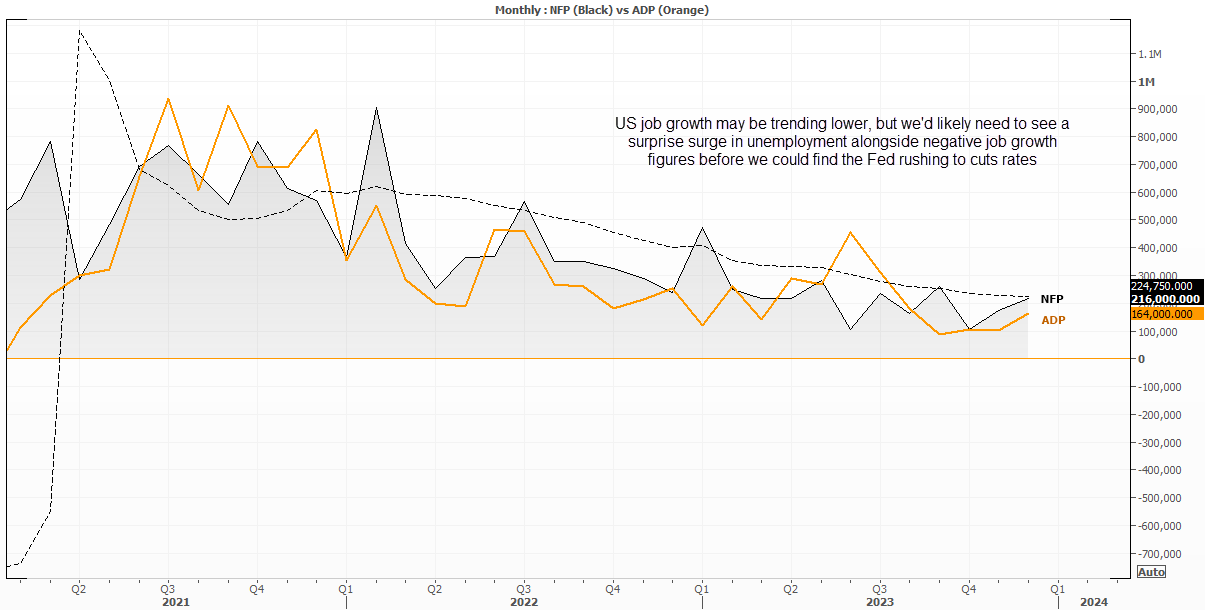
Nonfarm payroll report for the US
As next week’s ISM and NFP reports land after the FOMC meeting, it is really about shaping expectations from the March meeting onwards. And it might take quite a weak set of numbers to convince traders that a cut could arrive as early as March. IN all likelihood, the report will smash another set of okay or better numbers. As we’d really need to see unemployment rise sharply and NFP print negative jobs before we could expect the Fed to simply flick the policy switch.
Trader’s watchlist: EURUSD, USD/JPY, WTI Crude Oil, Gold, S&P 500, Nasdaq 100, Dow Jones
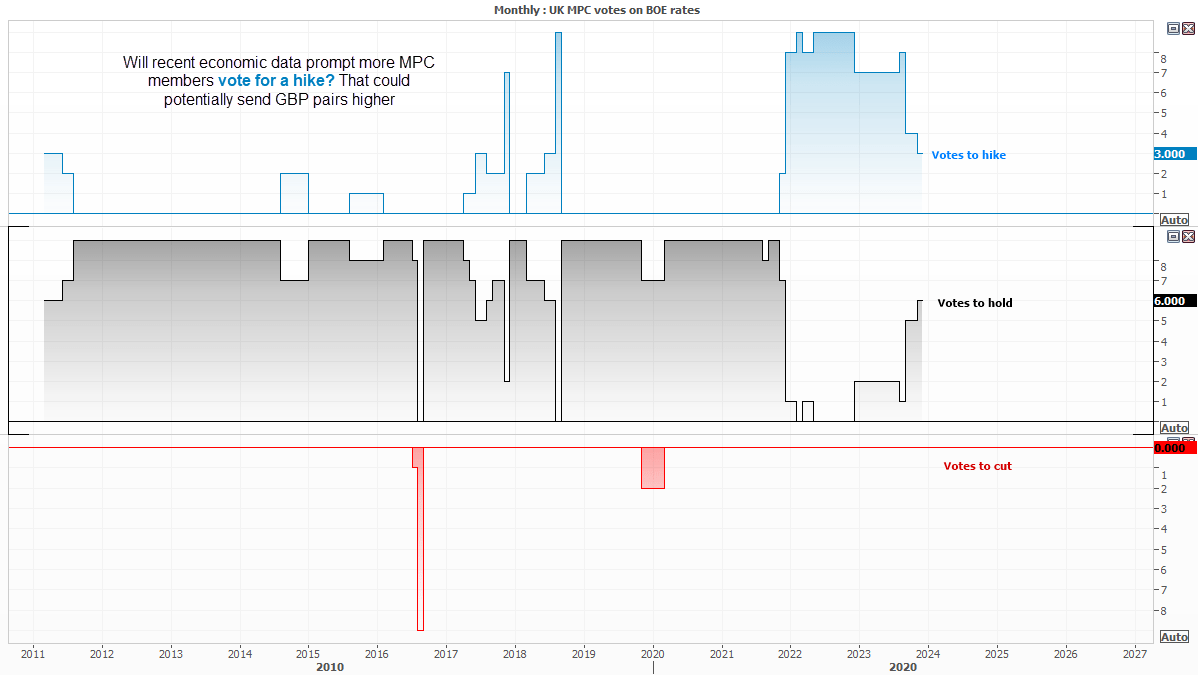
BOE interest rate decision
Recent data has effectively removed any hope of a BOE cut next week, or any time soon for that matter. CPI data rose unexpectedly in December, and PMI data has also surpassed expectations with the added pain of rising input costs.
Traders should keep an eye on any changes among MPC votes to hike or hold. The last meeting saw three vote to hike and six to hold, so if we see four or more vote to hike it indicates that the BOE is more hawkish in the light of incoming data – and whilst this might not necessarily result in a future hike, it almost certainly prolongs rates being held at the current level of 5.25%
Trader’s watchlist: GBP/USD, GBP/JPY, GBP/CHF, EUR/GBP, GBP/AUD, FTSE 100
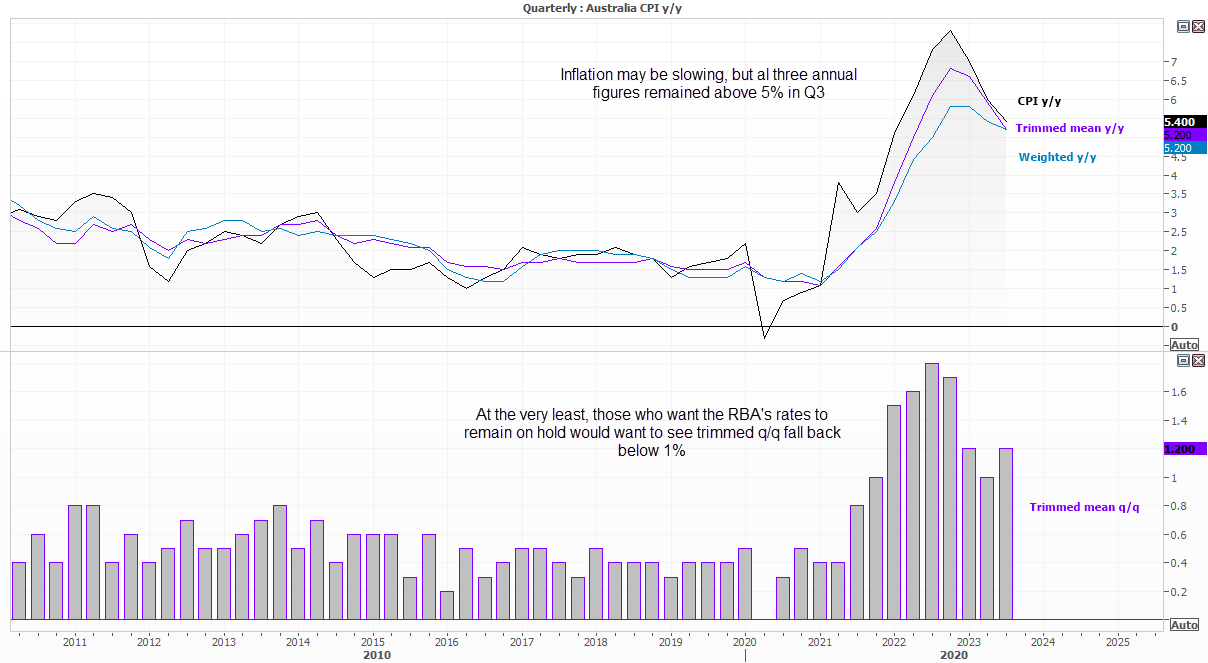
Quarterly CPI report for Australia
The RBA (and therefore traders) pay more attention to the quarterly CPI figures than the newer monthly report, as they are considered to be more robust. And the fact that headline CPI, trimmed ad weighted remained above 5% in Q3, they’ll want to see the rate of these inflation figures fall much faster. At the very least, they’ll want to see the trimmed mean q/q back below 1% to show momentum is waning, or it risks renewed calls for another RBA hike.
Trader’s watchlist: AUD/USD, NZD/USD, AUD/NZD, NZD/JPY, AUD/JPY, ASX 200
-- Written by Matt Simpson
Follow Matt on Twitter @cLeverEdge
How to trade with City Index
You can trade with City Index by following these four easy steps:
-
Open an account, or log in if you’re already a customer
• Open an account in the UK
• Open an account in Australia
• Open an account in Singapore
- Search for the market you want to trade in our award-winning platform
- Choose your position and size, and your stop and limit levels
- Place the trade
Latest market news
Yesterday 01:32 PM
Yesterday 09:35 AM
Yesterday 07:23 AM
Yesterday 04:48 AM
Yesterday 12:17 AM
July 25, 2024 10:39 PM
Latest Week ahead articles

Yesterday 04:48 AM

July 19, 2024 06:20 AM

July 12, 2024 01:32 AM
July 12, 2024 01:32 AM