


- Nasdaq analysis: Nvidia topped $2 trillion valuation in first for chipmakers, but rally lost steam Friday
- S&P 500 and Nasdaq hit fresh record highs before easing back
- Magnificent 7 stocks’ charts point to caution
Nasdaq analysis: Tech rally stalls as investors take profit
Last week saw equities display mania-like symptoms in Germany and other mainland European markets, as well as Japan, and a few other places. But it was nothing compared to the US, where one single stock (obviously, you know which one) was responsible for a vast majority of the gains for major indices. Nvidia’s blowout earnings results fuelled fresh buying frenzy on Wall Street, where the S&P 500 surpassed the 5,100 milestone for the first time to set a new record. The Nasdaq hit a fresh all-time high on Friday, as Nvidia’s valuation topped $2 trillion, becoming the first chipmaker to achieve this feat. However, as the session wore on, tech stocks started to ease back, before closing near their lows. This caused the major US indices to post some not-so-bullish looking candles on their charts, suggesting we could see some weakness on Monday.
Nasdaq analysis: What’s next for stocks?
Thursday saw Nvidia experience a remarkable one-day surge. The rally propelled its market capitalisation to $277 billion, marking the largest single-session increase in value ever recorded, surpassing Meta's recent $197 billion gain. But after the not-so-strong close on Friday, this has raised question marks about the potential sustainability of this tech-driven rally and its ability to extend across other sectors. Investors are wondering what the diminishing expectations for Federal Reserve rate cuts, fuelled by robust data indicating continued strength in the world's largest economy, may mean for stocks going forward. With over-stretched price-to-earnings ratios, many stocks in the tech sector are at risk of giving back some gains. Yet, so far, every dip has been bought, pointing to insatiable appetite for risk. Let’s see if that changes in the week ahead.
With most of the earnings now out of the way, the odds of early rate cuts slashed, and equity benchmarks hitting record highs in a period which historically has not been great for the markets, even the most bullish investors may feel that a correction, even if it turns out to be a small one, is warranted. In a healthy bull market, some give back is never a bad thing.
Magnificent 7 charts point to caution
The rally in stocks moderated on Friday, as investors presumably took profit on their long positions that they had accumulated during the week, knowing full well there is always the possibility of a correction at these elevated levels. Traders are now left wondering, whether to continue buying any small dips they see, or start looking for shorting opportunities once there is a concrete bearish signal to work with. Looking at the charts of the big tech giants, Friday’s price action does warrant some caution for the week ahead.
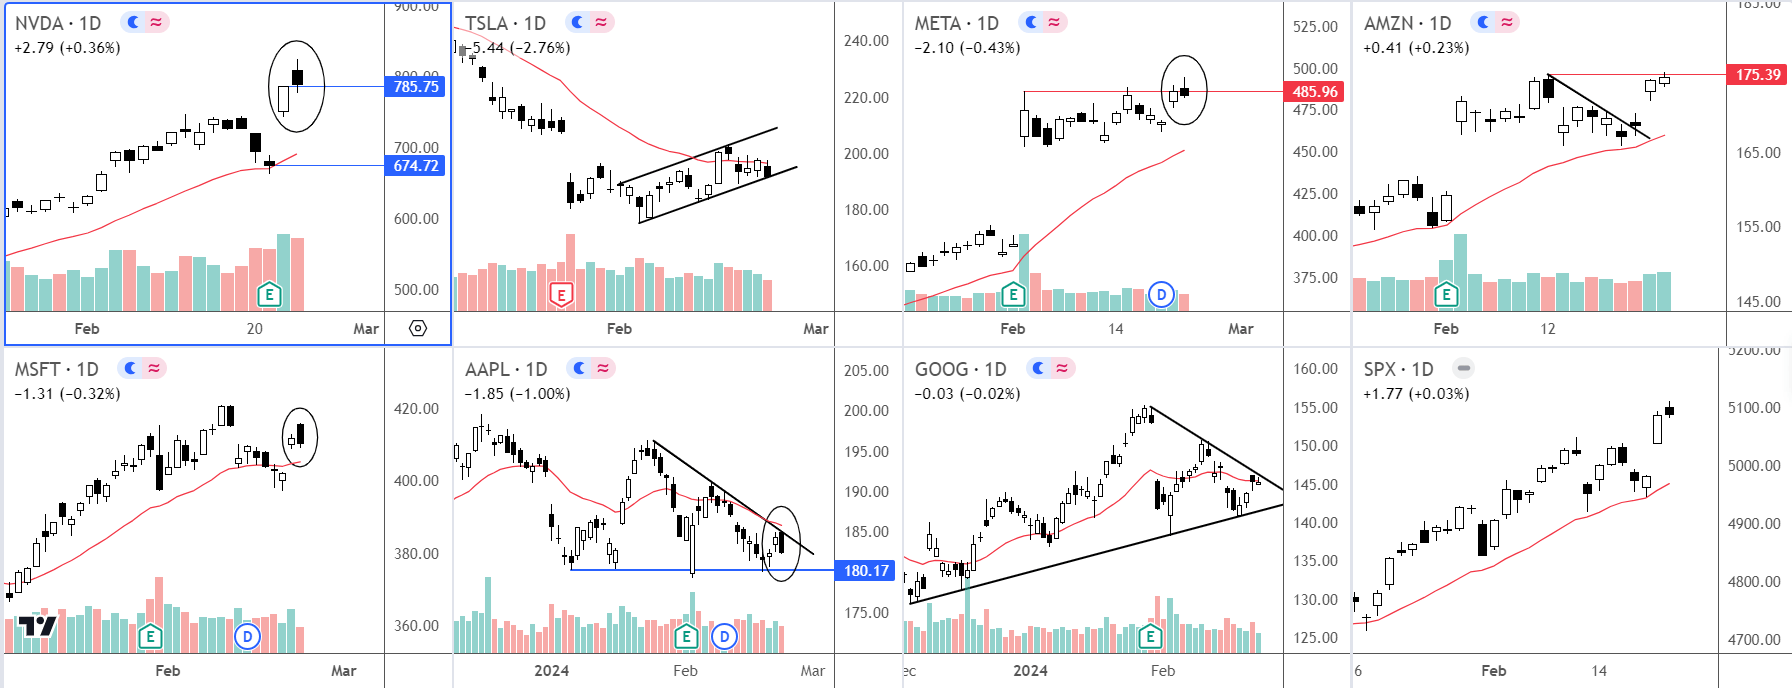
- Nvidia closed near Thursday’s close on heavy volume, as investors presumably took profit. The bearish close is a warning that Monday could see some profit-taking after the eye-watering gains, potentially weighing on the US indices.
- Tesla also closed near its lows, inside a bear flag pattern. A break below the support trend could give rise to some technical selling in the days ahead.
- Meta has had some difficulty clearing resistance around $485/6 area and it was again unable to posit a close above that level on Friday. So, a bit of a correction may be on the cards. The bullish trend has been very strong, though.
- Microsoft formed a bearish engulfing-like candle on its daily chart Friday, suggesting that it could head back down towards $400, and further work off its “overbought” conditions before it potentially moves again.
- Apple stock held below the bearish trend line and the 21-day exponential moving average, as it continues to trade inside a descending triangle pattern. Key support at $180 is still holding.

Nasdaq technical analysis
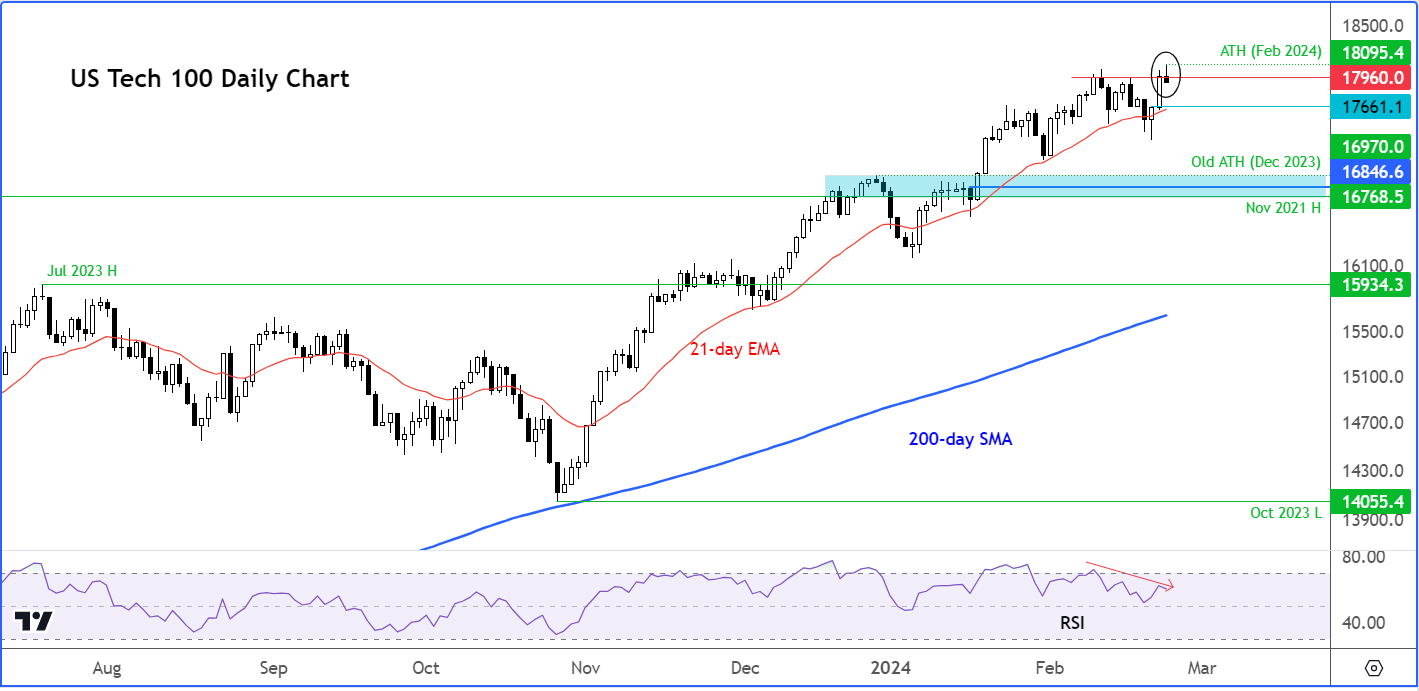
The Nasdaq formed an inverted hammer on the daily time frame on Friday, which is a warning sign that the bullish trend may have reached an exhaustion after a relentless rally. It definitely calls for bullish caution but is not necessarily an indication that the market has topped. The bears need to see a lower low form below last week’s low at 17315, before they can become confident that a peak has been reached. Standing on the way of that level is key support at 17660. This is the area the bulls will need to defend this week if they want to maintain this bullish trend and lift the Nasdaq to a new all-time high.
However, if that 17315 level breaks down, then a potential drop to test the December high at 16970 could be on the cards, with the November 2011 high coming at 16769.
So, as minimum, I am expecting to see a small pullback this week but have clear plans in case the bears take charge. For now, we can only assume that the retreat is a normal pullback you see in a healthy bullish trend. Let the charts guide you and leave emotions and what “should” happen aside.
Source for all charts used in this article: TradingView.com
-- Written by Fawad Razaqzada, Market Analyst
Follow Fawad on Twitter @Trader_F_R
How to trade with City Index
You can trade with City Index by following these four easy steps:
-
Open an account, or log in if you’re already a customer
• Open an account in the UK
• Open an account in Australia
• Open an account in Singapore
- Search for the company you want to trade in our award-winning platform
- Choose your position and size, and your stop and limit levels
- Place the trade
Latest market news
Yesterday 01:32 PM
Yesterday 09:35 AM
Yesterday 07:23 AM
Yesterday 04:48 AM
Yesterday 12:17 AM
July 25, 2024 10:39 PM
Latest Nasdaq articles

Yesterday 01:32 PM

July 25, 2024 01:17 PM

July 25, 2024 01:01 AM

July 23, 2024 01:38 PM