


Nasdaq 100 takeaways
- Last week’s big breakout in the Nasdaq 100 is facing its first major test
- The “Big 7” stocks that make up more than 50% of its weight are underperforming the broader index
- Bullish bias remains intact for now, but economic data will be key
Last week, we discussed the big breakout above 12,900 in the Nasdaq 100 and concluded that “only a reversal back below this week’s lows near 12,500 would erase the near-term bullish bias in the Nasdaq 100.”
Now, a week on, that bullish bias is facing its first big test.
The tech-heavy index rallied as high as 13,200 yesterday, but fears about a slowing US economy on the back of soft JOLTS, ADP, and ISM Services PMI figures have traders questioning whether instability in the banking system and the delayed impact of interest rate hikes over the last year could tip the economy into recession.
Even more than other indices, the Nasdaq 100 is very top-heavy, with the majority of the index’s weighting in just seven “Big Tech” names. As the chart below shows, outside of Alphabet (GOOG and GOOGL), all of these behemoths are underperforming the index’s -1.0% move today as we go to press:
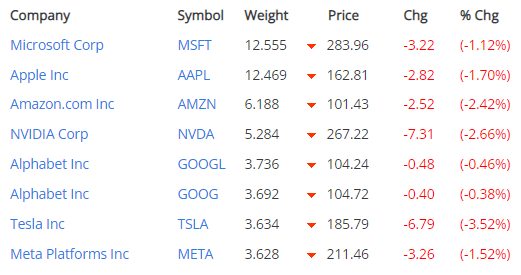
Source: Slickcharts
Nasdaq 100 technical analysis: US TECH 100 daily chart
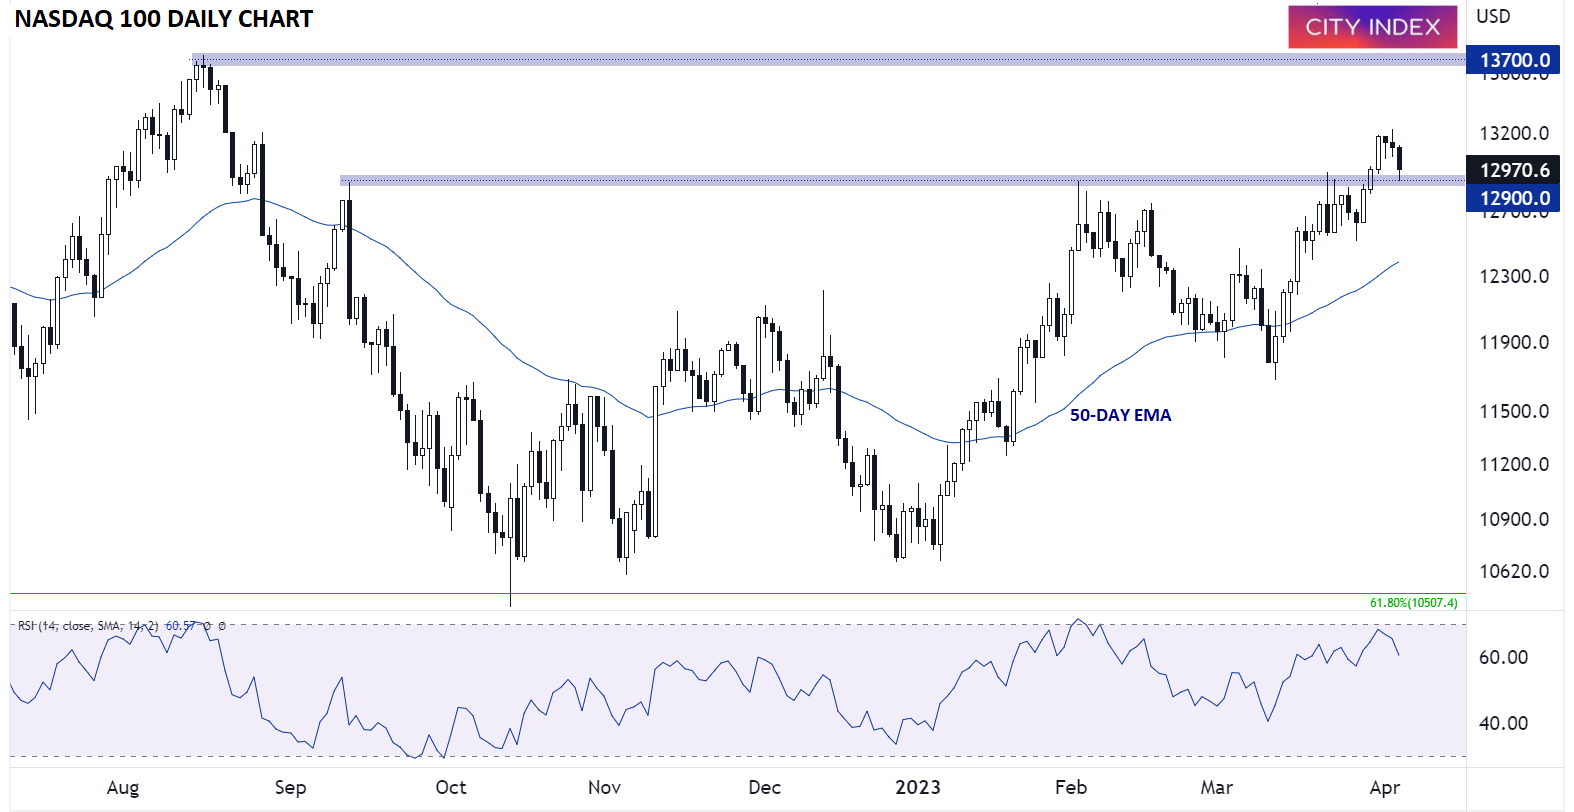
Source: StoneX, TradingView. Please note this product may not be available in all regions.
Looking at the chart above, the index has retraced back to the key 12,900 level. As many experienced traders know, breakouts have a tendency to revisit the proverbial “scene of the crime;” in other words, the Nasdaq 100 has retraced back to its initial breakout level, and it now remains to be seen if that previous resistance level will become support moving forward.
For now, a bullish bias remains appropriate with the index still above the key 12,900 level, but any more weakness, especially on the back of soft economic data in the coming days, would call that optimistic outlook into question.
-- Written by Matt Weller, Global Head of Research
Follow Matt on Twitter @MWellerFX
How to trade with City Index
You can trade with City Index by following these four easy steps:
-
Open an account, or log in if you’re already a customer
• Open an account in the UK
• Open an account in Australia
• Open an account in Singapore
- Search for the market you want to trade in our award-winning platform
- Choose your position and size, and your stop and limit levels
- Place the trade
Latest market news
Yesterday 01:32 PM
Yesterday 09:35 AM
Yesterday 07:23 AM
Yesterday 04:48 AM
Yesterday 12:17 AM
July 25, 2024 10:39 PM
Latest Nasdaq articles

Yesterday 01:32 PM

July 25, 2024 01:17 PM

July 25, 2024 01:01 AM

July 23, 2024 01:38 PM