


Nasdaq 100 takeaways
- The Nasdaq 100 is trading at a 7-month high, up more than 20% in three months to enter a new “bull market”
- The tech-heavy index recently saw a “golden cross” of the 50-day EMA above the 200-day EMA, signaling a shift back to a longer-term uptrend
- The next major resistance level to watch is the August 2022 high near 13,700
At the start of the year, the prospects for the tech- and growth-heavy Nasdaq 100 was downbeat. The index was testing its lowest levels since mid-2020, economic growth was expected to slow sharply (if not tip into an outright recession), and the Fed was poised to keep raising interest rates well above 5%.
Oh, what a difference a few months can make!
Now, as we wind down the first quarter of the year, the Nasdaq 100 is hitting a 7-month high, the US economy continues to chug along, and most analysts expect that the Fed is at (or at least very near to) its peak interest rate for this cycle. Just yesterday, the index closed up 20% from its record closing low, ostensibly entering a “bull market” for some commentators.
As we flip our calendars to April, the next major hurdle to watch will be Q1 earnings season, with major US banks expected to report results starting in the middle of the month, followed by Netflix, Tesla, and the rest of the big tech behemoths by the end of the month.
Nasdaq 100 technical analysis: NDX (US Tech 100) daily chart
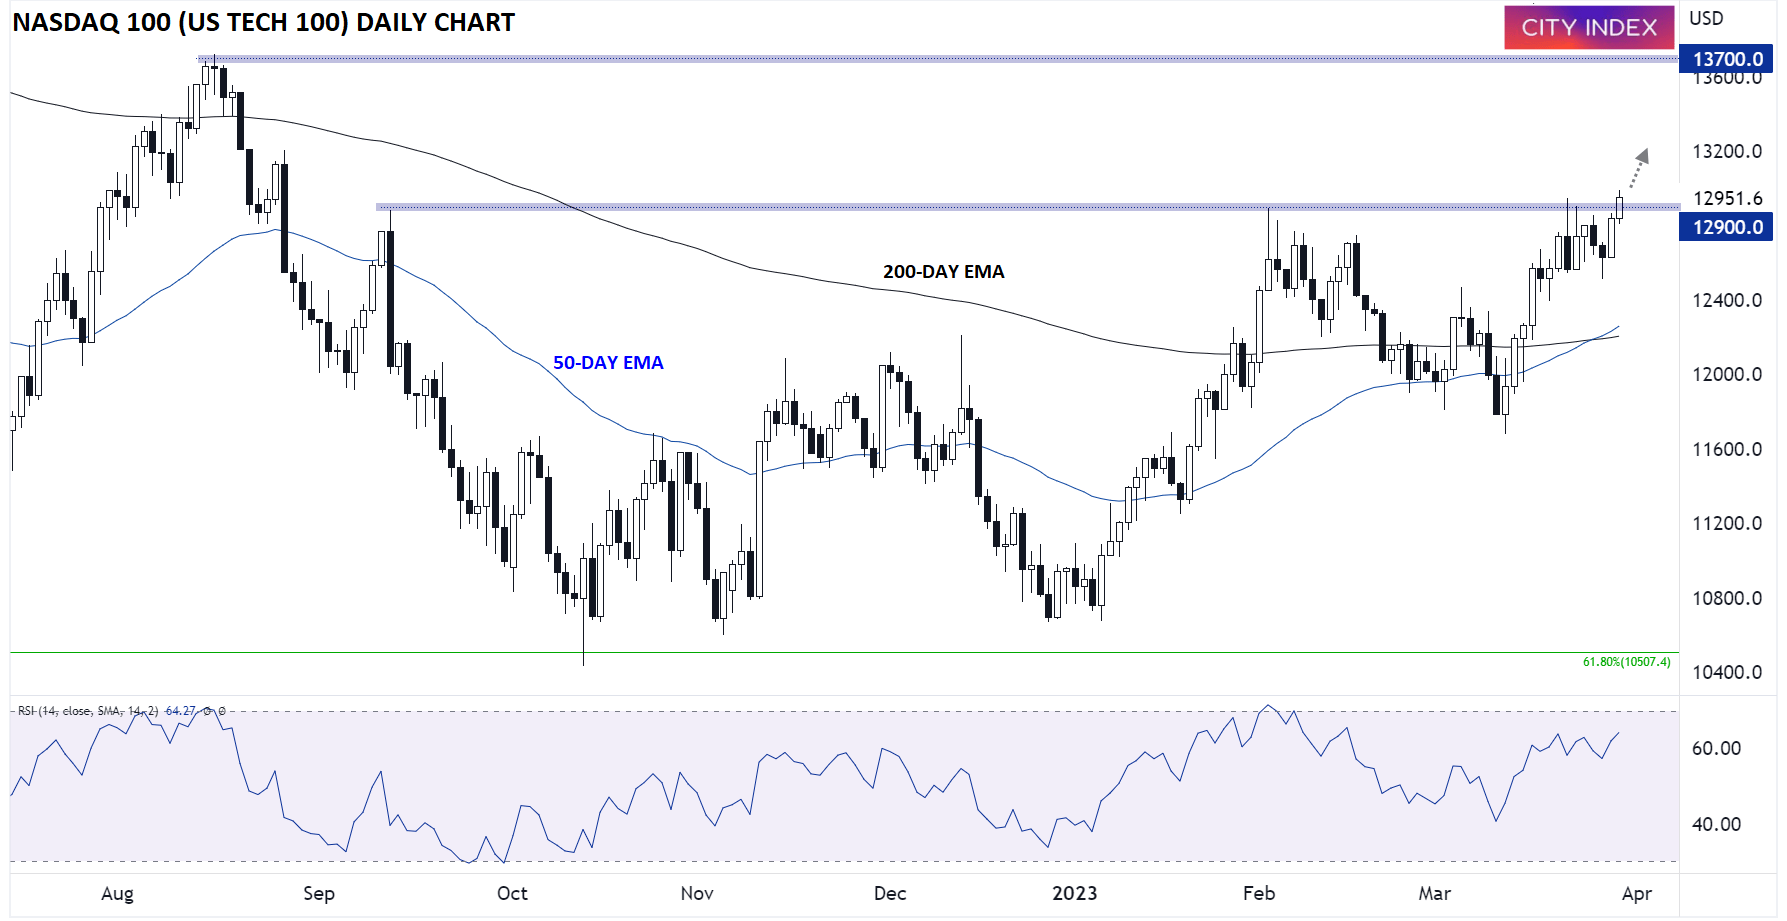
Source: StoneX, TradingView.
As the chart above shows, the Nasdaq 100 is peeking out above strong previous resistance in the 12,900 area. The index saw a “golden cross” of its 50-day EMA above the 200-day EMA earlier this week, signaling a shift back to a longer-term bullish trend.
A sustained breakout above 12,900 resistance would also confirm a cup-and-handle formation over the last two months. For the uninitiated, this bullish pattern shows strong buying pressure and would project a move to at least the August 2022 high near 13,700 in time, if not higher.
At this point, only a reversal back below this week’s lows near 12,500 would erase the near-term bullish bias in the Nasdaq 100.
-- Written by Matt Weller, Global Head of Research
Follow Matt on Twitter @MWellerFX
How to trade with City Index
You can trade with City Index by following these four easy steps:
-
Open an account, or log in if you’re already a customer
• Open an account in the UK
• Open an account in Australia
• Open an account in Singapore
- Search for the market you want to trade in our award-winning platform
- Choose your position and size, and your stop and limit levels
- Place the trade
Latest market news
Yesterday 01:32 PM
Yesterday 09:35 AM
Yesterday 07:23 AM
Yesterday 04:48 AM
Yesterday 12:17 AM
July 25, 2024 10:39 PM
Latest Nasdaq articles

Yesterday 01:32 PM

July 25, 2024 01:17 PM

July 25, 2024 01:01 AM

July 23, 2024 01:38 PM