


Nasdaq 100 takeaways
- A strong NFP report and the resolution of the debt ceiling drama has traders in a “risk on” mood.
- The Nasdaq 100 is breaking out above resistance to its highest level since last April.
- There is little in the way of meaningful resistance until above 15,000, though the index is overbought and may be vulnerable to a pause or pullback next week.
Nasdaq 100 fundamental analysis
Overnight, the US Senate voted 63-36 to approve the debt ceiling bill, sending it to President Biden’s desk for a perfunctory signature. Of course, the market had already priced in this development, and while the timeline got relatively tight at the end, traders never panicked throughout the ordeal, seeing through the politicking to inevitable conclusion.
Instead, economic data has taken to the fore this week, highlighted by this morning’s highly-anticipated non-farm payrolls report. For the 15th month in a row, the headline NFP reading beat expectations, coming in at 339K vs. just 193K eyed; the prior two months’ readings were also revised higher by nearly 100K jobs in aggregate.
Though the headline reading was stellar, some of the “below the hood” details of the NFP report were more mixed: The unemployment rate rose from 3.4% to 3.7%, and wages grew at 0.3% m/m, brining down the year-over-year rate to 4.3%. On balance, the US labor market clearly remains healthy, with perhaps some early signs that it may be cooling off slightly (if one were to squint!).
For chorus of Federal Reserve speakers who generally touted the merits of “skipping” a 25bps interest rate hike in June to gather more data, this month’s jobs report likely provides just enough latitude for the central bank to hold fire later this month, as long as the CPI report on June 13th comes in at or below expectations.
Today’s strong-but-not-worryingly-so jobs report falls in the “goldilocks zone” for risk appetite, taking indices like the S&P 500 and Nasdaq 100 to fresh year-to-date highs.
Nasdaq 100 technical analysis – NDX daily chart
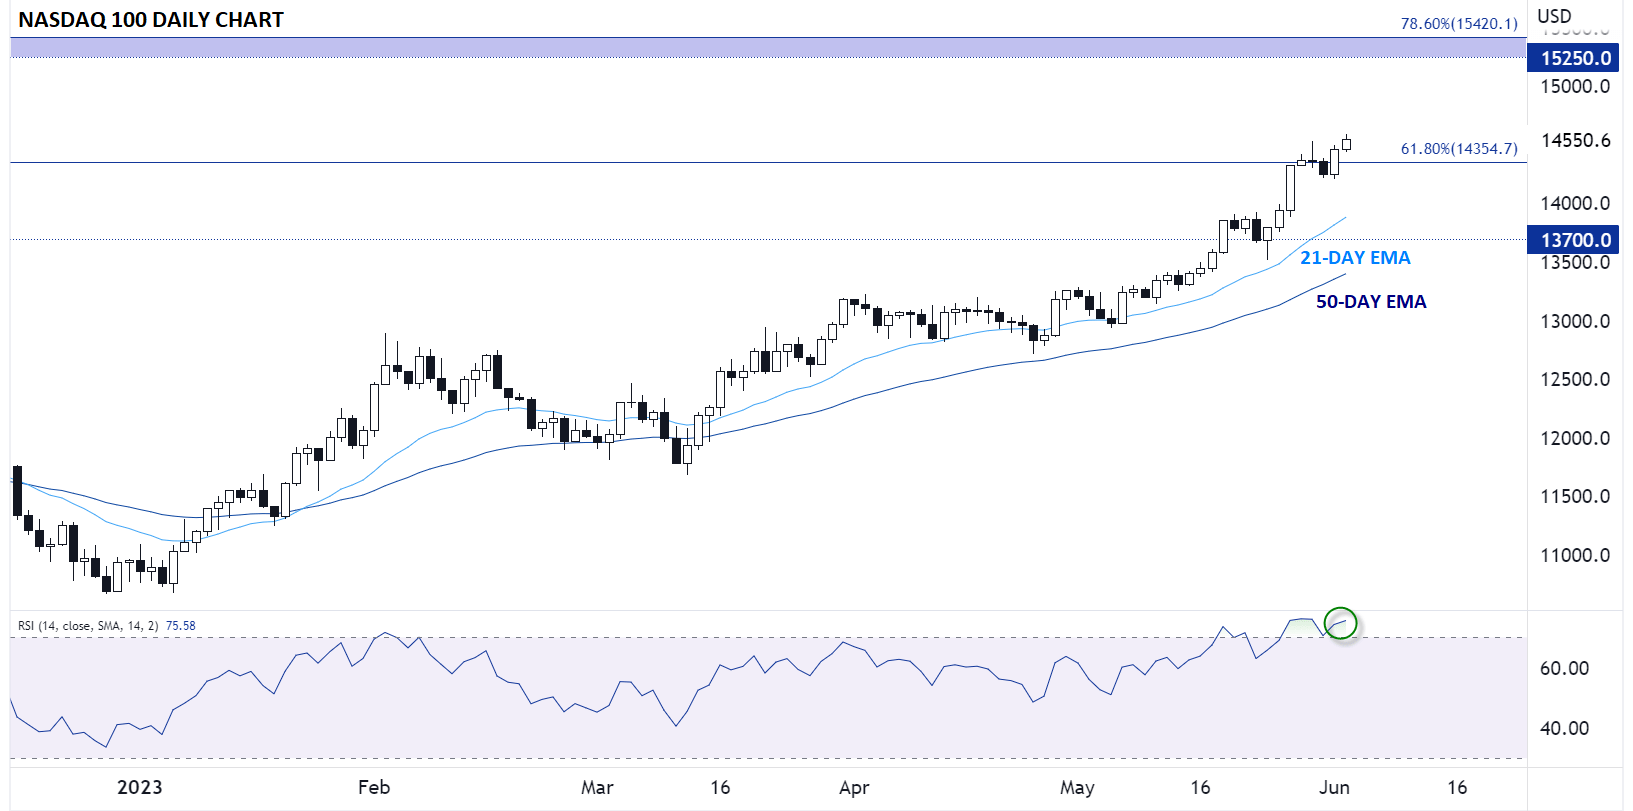
Source: TradingView, StoneX
As the chart above shows, the Nasdaq 100 is building on yesterday’s gains to trade above the 14,500 level, its highest print since last April. Assuming it can finish the day and week near current levels, this week’s price action will represent a confirmed bullish break above the 61.8% Fibonacci retracement of the 2021-2022 bear market, leaving little in the way of resistance until confluence of previous highs and the 78.6% Fibonacci retracement above 15,000.
While the year-to-date trend and momentum clearly favor the bulls, readers should note that the 14-day RSI is well within overbought territory (> 70), suggesting the index may be vulnerable to a pause or pullback next week. Swing traders may prefer to buy dips toward the 14,000 area to join the established uptrend at a more favorable price.
-- Written by Matt Weller, Global Head of Research
Follow Matt on Twitter: @MWellerFX
How to trade with City Index
You can trade with City Index by following these four easy steps:
-
Open an account, or log in if you’re already a customer
• Open an account in the UK
• Open an account in Australia
• Open an account in Singapore
- Search for the market you want to trade in our award-winning platform
- Choose your position and size, and your stop and limit levels
- Place the trade
Latest market news
Yesterday 01:32 PM
Yesterday 09:35 AM
Yesterday 07:23 AM
Yesterday 04:48 AM
Yesterday 12:17 AM
July 25, 2024 10:39 PM
Latest Nasdaq articles

Yesterday 01:32 PM

July 25, 2024 01:17 PM

July 25, 2024 01:01 AM

July 23, 2024 01:38 PM