


USD/JPY Takeaways
- US yields continue their relentless march higher while Japanese 10-year yields remain mired well below 1.00%.
- USD/JPY is holding steady near its highest levels of the year, with traders watching the well-defined short-term range from 145.00-146.60.
- A bullish breakout would open the door for a rally into the upper-140s, though the risk of intervention to strengthen the yen would rise with every tick higher.
USD/JPY Fundamental Analysis
When it comes to the US dollar broadly (and against the Japanese yen in particular), the major driving force for exchange rates lately has been bond yields. Yesterday, the benchmark 10-year treasury yield closed above 4.30% for the first time since the depths of the GFC back in 2009, and the more monetary policy sensitive 2-year treasury yield is testing 17-year highs of its own above 5.00%.
Meanwhile, despite a wishy-washy Bank of Japan attempt to loosen the 0.5% cap on its 10-year bonds last month, the 10-year Japanese government bond is still yielding a paltry 0.67%, presenting a clear (and widening) interest rate differential on either side of the Pacific. As long as the US economy continues to post surprising growth and the Japanese economy remains stuck in the proverbial mud, this interest rate differential will continue to support strength in the greenback relative to the yen.
Japanese Yen Technical Analysis – USD/JPY Daily Chart
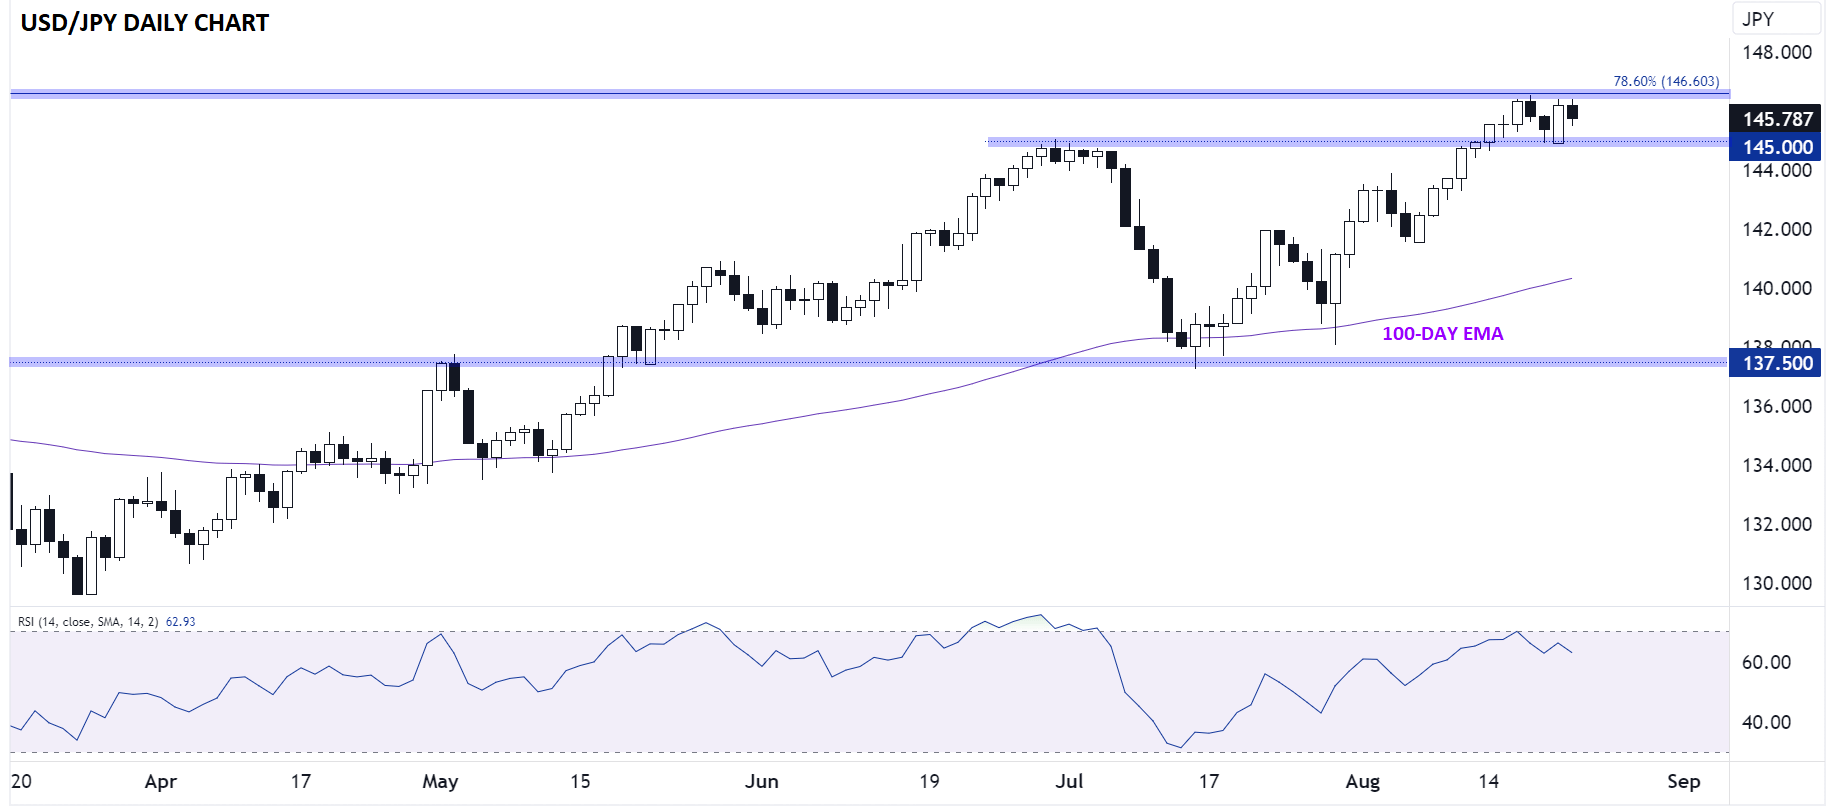
Source: TradingView, StoneX
As the chart above shows, USD/JPY has carved out a well-defined short-term range between previous-resistance-turned-support at 145.00 and the 78.6% Fibonacci retracement at 146.60. With today’s pullback, the pair remains solidly in the middle of that range, leaving the short-term outlook neutral, but given the clear uptrend and ever-widening yield differential, the technical bias remains for a bullish breakout in the coming days.
If we do see a bullish breakout, the next levels of technical resistance to watch will be the November high near 149.00 and the October peak above 151.00, though it is worth noting that the risk of BOJ intervention will rise with every tick higher above 147.00. Meanwhile, a downside break of 145.00 support could point to a deeper retracement toward the mid-143.00s before support emerges.
-- Written by Matt Weller, Global Head of Research
Follow Matt on Twitter: @MWellerFX
Latest market news
Today 01:39 PM
Today 11:05 AM
Today 10:46 AM
Latest USD/JPY articles


April 19, 2024 12:00 PM

April 17, 2024 02:40 PM