


The SuperTrend indicator is a useful tool for any technical trader – helping you identify trends and generate signals at a glance. Learn all about trading with the SuperTrend here.
- What is the SuperTrend indicator?
- How to use the SuperTrend indicator
- How does the SuperTrend work?
- SuperTrend indicator strategy
- SuperTrend FAQs
What is the SuperTrend indicator?
The SuperTrend indicator is a technical tool that you can use to identify trends and generate buy/sell signals. It takes the form of a single line that’s overlaid onto a market’s chart and follows the price action, switching from red to green as momentum shifts.
You can use the SuperTrend indicator across almost any market or timeframe, although it’s particularly popular among day traders. Why? Because it is easy to use and generates plenty of signals on trending markets.
Learn more about technical indicators.
SuperTrend vs moving average
At first, the SuperTrend indicator can look like a moving average – it's a line that follows price action and is used in a similar way. However, it works very differently. While a moving average is simply an average of a market’s price over a set number of sessions, the SuperTrend calculation is much more complex. We’ll cover this in more detail later.
How to use the SuperTrend indicator
There are two main ways to use the SuperTrend indicator: to identify trends and to generate signals. Both are easy to do with the tool, which is designed to help you trade quickly.
Identifying trends with the SuperTrend
To identify a trend with the SuperTrend, you simply look to see whether the indicator line is green or red. If it is green, then the tool is signalling bullish conditions. If it is red, then it is signalling a bearish market.
However, it is worth noting that the SuperTrend will always be either red or green: it switches to red when the market’s price is below the line, and green when it crosses above. It can’t identify rangebound or static markets, making it best used in conjunction with other indicators.
SuperTrend signals
The SuperTrend generates a new signal when the line crosses the market’s price and the colour switches:
- When the indicator switches from red to green, it generates a bullish signal
- When the indicator switches from green to red, it is a bearish signal
It is the simplicity of these signals that makes the indicator popular. In fast-moving markets, you can spot new opportunities instantly.
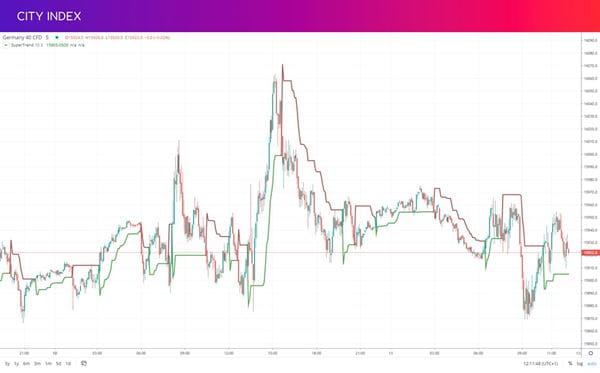
However, as you can see on the DAX 40 chart above, some signals are stronger than others. So, again, it is best to use the SuperTrend indicator alongside other tools like the RSI or stochastic oscillator, to ensure your market has momentum.
The SuperTrend also gives little indication of profit targets or stop loss levels – and as a lagging indicator, only tells you once a trend is already underway.
How does the SuperTrend indicator work?
The SuperTrend indicator works using two inputs, both applied to the market’s current median price: an average true range (ATR) and a multiplier. You can adjust the settings on either, which will make the indicator more or less sensitive to current price action.
- A shorter timeframe on the ATR and smaller multiplier results in a SuperTrend line that’s closer to the price action, generating more signals
- A longer timeframe and bigger multiplier will make the SuperTrend line further away, generating fewer, stronger signals
To calculate the SuperTrend, then, you first need work out the average true range for your chosen timeframe and pick a multiplier. The standard timeframe for the ATR is 10 sessions, with a multiplier of three.
Once you’ve done that, you can calculate the two lines that form the basis of the SuperTrend using the following two formulas.
SuperTrend indicator formula
Upper SuperTrend = Median price + (ATR x multiplier)
Lower SuperTrend = Median price – (ATR x multiplier)
The median price is simply your market’s highest point plus its lowest point in the session, divided by two.
You might have noticed that the calculations above will return two figures – but that the SuperTrend only generates a single line. That’s because the indicator switches which formula it uses each time the asset’s price crosses the line currently in use.
In addition, if the upper SuperTrend line is in use, then it can never rise. If the lower SuperTrend line is in use, it can never fall. This ensures that the asset’s price will cross the active line if momentum switches.
Confused? Don’t worry, you won’t have to calculate the SuperTrend indicator yourself. The City Index trading platform does it automatically.
SuperTrend formula example
Say, for instance, that Apple is in an uptrend, meaning that the lower green SuperTrend line is currently showing. The stock is trading at $180, with a high of $190 and a low of $176 – giving it a median price of $183. You can see how to calculate its average true range here, but for this example let’s give it an ATR of three and use the standard multiplier of three as well.
Lower SuperTrend = 183 – (3 x 3) = 174
Apple’s price of 180 is above the SuperTrend line of 174, indicating a continued bull run.
But what if Apple’s price falls to $160, with a median of $162?
Lower SuperTrend = 162 – (3 x 3) = 153
153 is lower than 174 – but the lower line can never fall, meaning it stays at 174. Apple’s new price of $160 is below the lower band of $174, so the indicator switches and uses the upper line instead.
Upper SuperTrend = 162 + (3 x 3) = 171
SuperTrend indicator strategy
To create your own SuperTrend indicator strategy, follow these steps:
- Decide what timeframe you want to trade on. Day traders, for example, keep positions open for hours or minutes. For position traders, it’s months or even longer
- Choose your markets. The SuperTrend works with any asset class, including forex, indices, shares and commodities
- Apply the SuperTrend indicator to your chosen chart. On the City Index platform, you do this by searching for ‘SuperTrend’ in the indicators menu on any chart
- Once the SuperTrend switches colour, consider opening a position based on the new trend. If the indicator is green, buy. If it is red, sell
- At this point, you might want to add another indicator to your strategy to confirm market conditions
- Add a stop loss to keep your risk in check
- Keep your position open until the SuperTrend switches again, or your stop loss is triggered

Of course, you’ll need to open a City Index account to start trading. You can open one entirely online, and it costs nothing – although you’ll need to add funds to open positions.
Not ready for live markets? You can test out your SuperTrend strategy with zero risk using a City Index trading demo. It gives you virtual funds to trade on real market prices, enabling you to try out trading in a sandbox environment.
Best indicator with the SuperTrend
As we’ve seen, it isn’t really recommended to use the SuperTrend in isolation. Its lagging nature and capacity to generate false signals in rangebound markets present too many risks. Here are a few tools that are often paired with it:
- The RSI and stochastic oscillator. The relative strength index and stochastic oscillator are two momentum indicators that can measure trends. This makes them useful for ensuring that your market isn’t rangebound and confirming trends signalled by the SuperTrend
- The average directional index (ADX). If the ADX is above 25, then a market is strongly trending – meaning you can use it in the same way as the RSI or stochastic
- The parabolic SAR. The parabolic SAR is used in a similar way to the SuperTrend – so if both generate the same signal, it is stronger
- Candlestick patterns. If you spot a reversal pattern landing as the SuperTrend changes colour, it reinforces the signal
In addition, you should always ensure that you have a stop loss attached to any position, to close your trade should it move against you.
SuperTrend FAQs
Is the SuperTrend a good indicator?
The SuperTrend can be a good indicator, as long as you’re using it in the right conditions and with a comprehensive risk management strategy in place. It can be popular among beginner traders due to its ease of use.
However, like any indicator the signals generated by the SuperTrend require analysis as they will not all lead to successful trades.
What are the best SuperTrend indicator settings?
The standard settings for the SuperTrend are an ATR of 10 and a multiplier of three. The best settings for you depend on your strategy and style – day traders may lower both figures to generate more signals, while longer-term traders may make them higher.
Is the SuperTrend indicator reliable?
The SuperTrend indicator can be reliable in strongly trending markets. However, it is prone to creating false signals when a market is rangebound or consolidating, so proper risk management is essential.
Latest market news
Yesterday 06:37 AM
April 26, 2024 01:25 PM
April 26, 2024 11:40 AM
April 25, 2024 03:09 PM
Latest Technical Analysis articles


April 24, 2024 02:03 AM

April 22, 2024 04:33 PM

April 21, 2024 11:20 PM