


Gold Technical Forecast: XAU/USD Weekly Trade Levels
- Gold snaps four-week rally – now testing November uptrend
- XAU/USD carving August opening-range just above confluent support
- Gold resistance 1965, 1988, 2009/17 – support 1919/29 (key), 1891, 1871
Gold prices are poised to snap a four-week winning streak with XAU/USD down more than 0.9% ahead of the close on Friday. The decline was halted at a key technical confluence this week and the focus now falls on a breakout of the August opening range. It’s the moment of truth for the bulls. These are the updated targets and invalidation levels that matter on the XAU/USD weekly technical chart.
Review my latest Weekly Strategy Webinar for an in-depth breakdown of this gold setup and more. Join live on Monday’s at 8:30am EST.
Gold Price Chart – XAU/USD Weekly
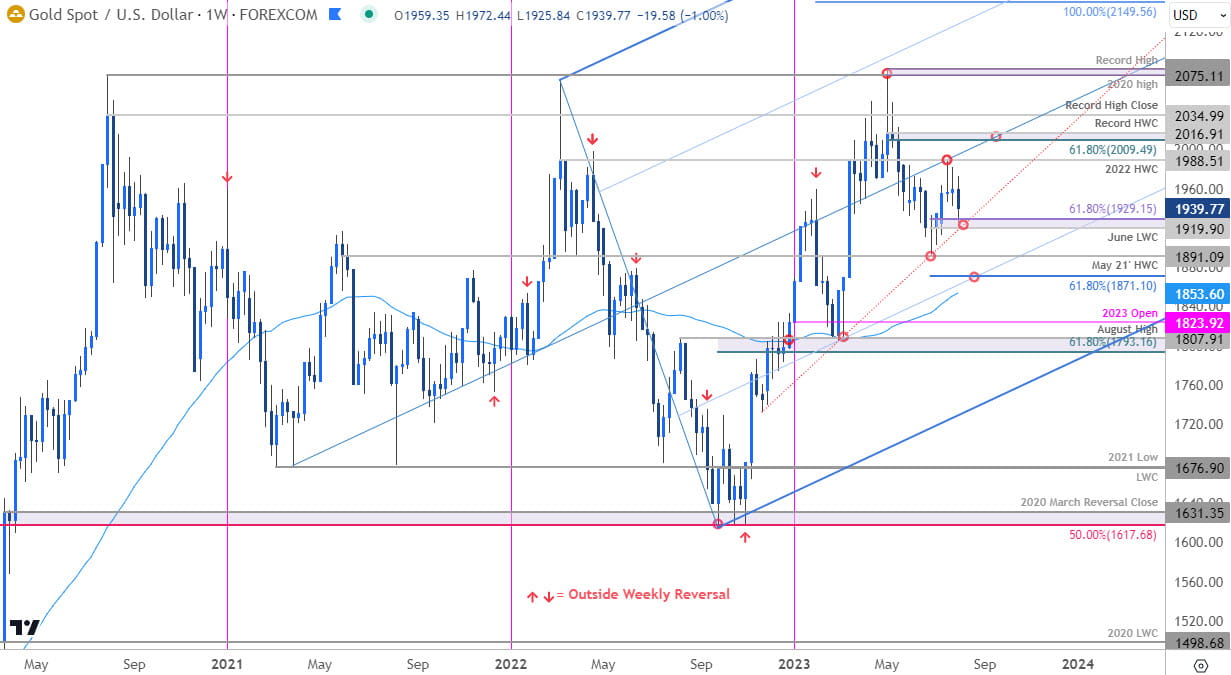
Chart Prepared by Michael Boutros, Technical Strategist; XAU/USD on TradingView
Technical Outlook: In last month’s Gold Weekly Price Forecast we noted that XAU/USD had, “responded to confluent support around 1900 and keeps the outlook weighted to the topside while above the November trendline (red).” Topside resistance was eyed at, “the 38.2% retracement of the May decline at 1965 backed closely by the 2022 high-week close at 1988.”
Gold prices registered an intraday high at 1987 the following week before reversing with the decline testing support this week at 1919/29- a region defined by the June low-week close and the 61.8% Fibonacci retracement of the June advance. Note that the November trendline converges on this range over the next few weeks and further highlights its technical significance.
Monthly open resistance now 1965 backed again by 1988. Ultimately, a breach / close above the 61.8% retracement of the May decline / record high-week close at 2009/17 needed to mark resumption of the broader uptrend towards the record high-close at 2035 and the swing highs at 2075/81.
A break below this key pivot zone would threaten another accelerated decline towards the Mary 2021 high-week close at 1891 and the 61.8% extensions of the yearly a decline at 1871 (note the 52-week moving average just lower at ~1853)- look for a larger reaction there IF reached.
Bottom line: Gold is testing a pivot zone here at multi-month uptrend support with the August opening-range taking shape just above- look to the breakout for guidance. From at trading standpoint, losses should be limited by 1919 IF price is heading higher on this stretch with a breach / close above 2017 needed to mark resumption of the broader uptrend. Review my latest Gold Short-term Technical Outlook for a closer look at the near-term XAU/USD technical trade levels.
Key Economic Data Releases
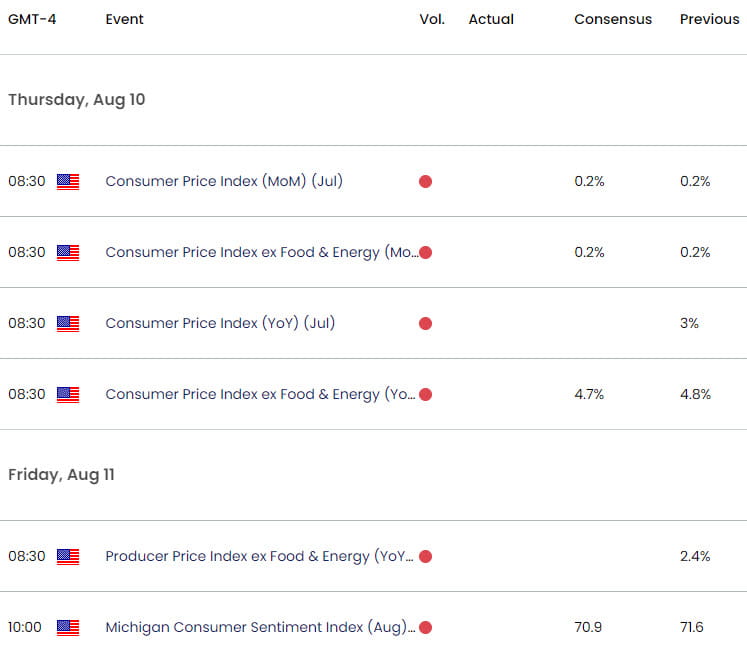
Economic Calendar - latest economic developments and upcoming event risk.
Active Weekly Technical Charts
- Euro (EUR/USD)
- Canadian Dollar (USD/CAD)
- British Pound (GBP/USD)
- Australian Dollar (AUD/USD)
- US Dollar (DXY)
- Crude Oil (WTI)
--- Written by Michael Boutros, Sr Technical Strategist with FOREX.com
Follow Michael on Twitter @MBForex
Latest market news
Today 11:05 AM
Today 10:46 AM
Today 05:56 AM
Latest Gold articles

April 1, 2024 01:09 PM

March 28, 2024 10:30 AM

March 26, 2024 11:24 PM

March 26, 2024 12:00 PM