


Gold Key Points
- Gold is seeing a notable rally to record highs despite otherwise quiet trading conditions.
- Expectations of a Fed rate cut this quarter are supporting the bullion.
- XAU/USD’s technical outlook remains bullish above previous-resistance-turned-support near $2200.
With most of Europe still out of the office for the long Easter holiday, markets are playing an April Fool’s Day trick on any traders expecting volatility today.
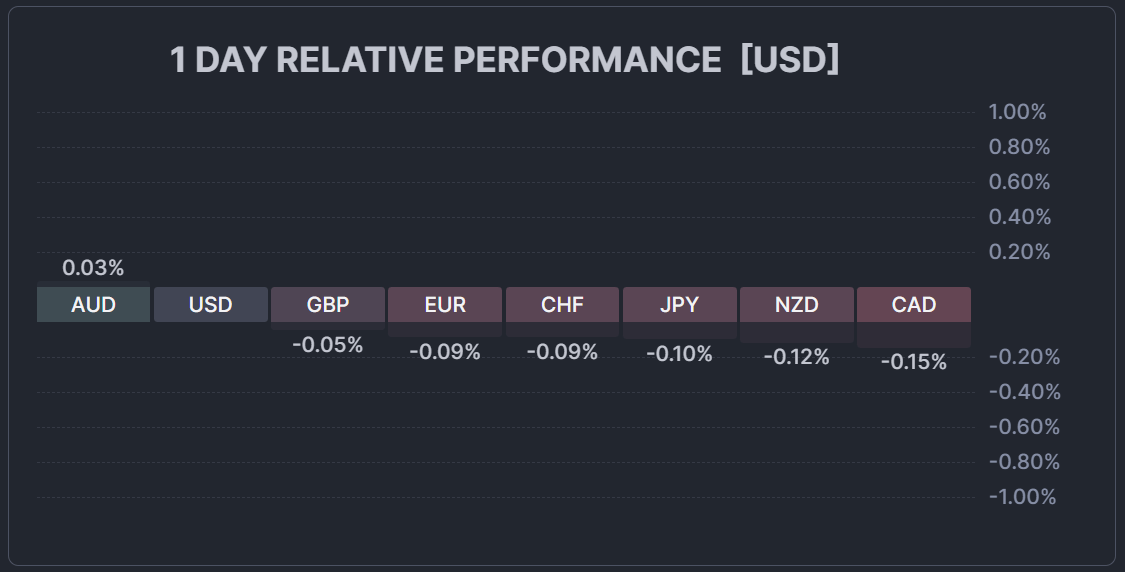
Source: FinViz
That said, there is one notable move on the screens at the US open: Gold is in rally mode, hitting a fresh all-time record high above $2250 in the wake of as-expected Core PCE data on Friday. In an interview following the release, Federal Reserve Chairman Jerome Powell characterized the inflation data as “along the lines of what [the Fed] would like to see” in order to start cutting interest rates, stoking traders’ expectations that the Fed’s easing cycle will start later this quarter.
As a reminder, gold prices tend to move inversely with interest rates. When interest rates fall, gold becomes relatively more attractive compared with fixed income assets such as bonds, which offer weaker returns in a lower interest rate environment. Or put differently, lower interest rates reduce the opportunity cost of holding gold.
Looking ahead, markets will be keying in on Friday’s highly-anticipated Non-Farm Payrolls (NFP) report to see if it confirms a soft landing in the US jobs market. Traders and economists are expecting the report to show about 205K net new jobs were created in March after an initial estimate of 275K in February.

Gold Technical Analysis – XAU/USD Daily Chart
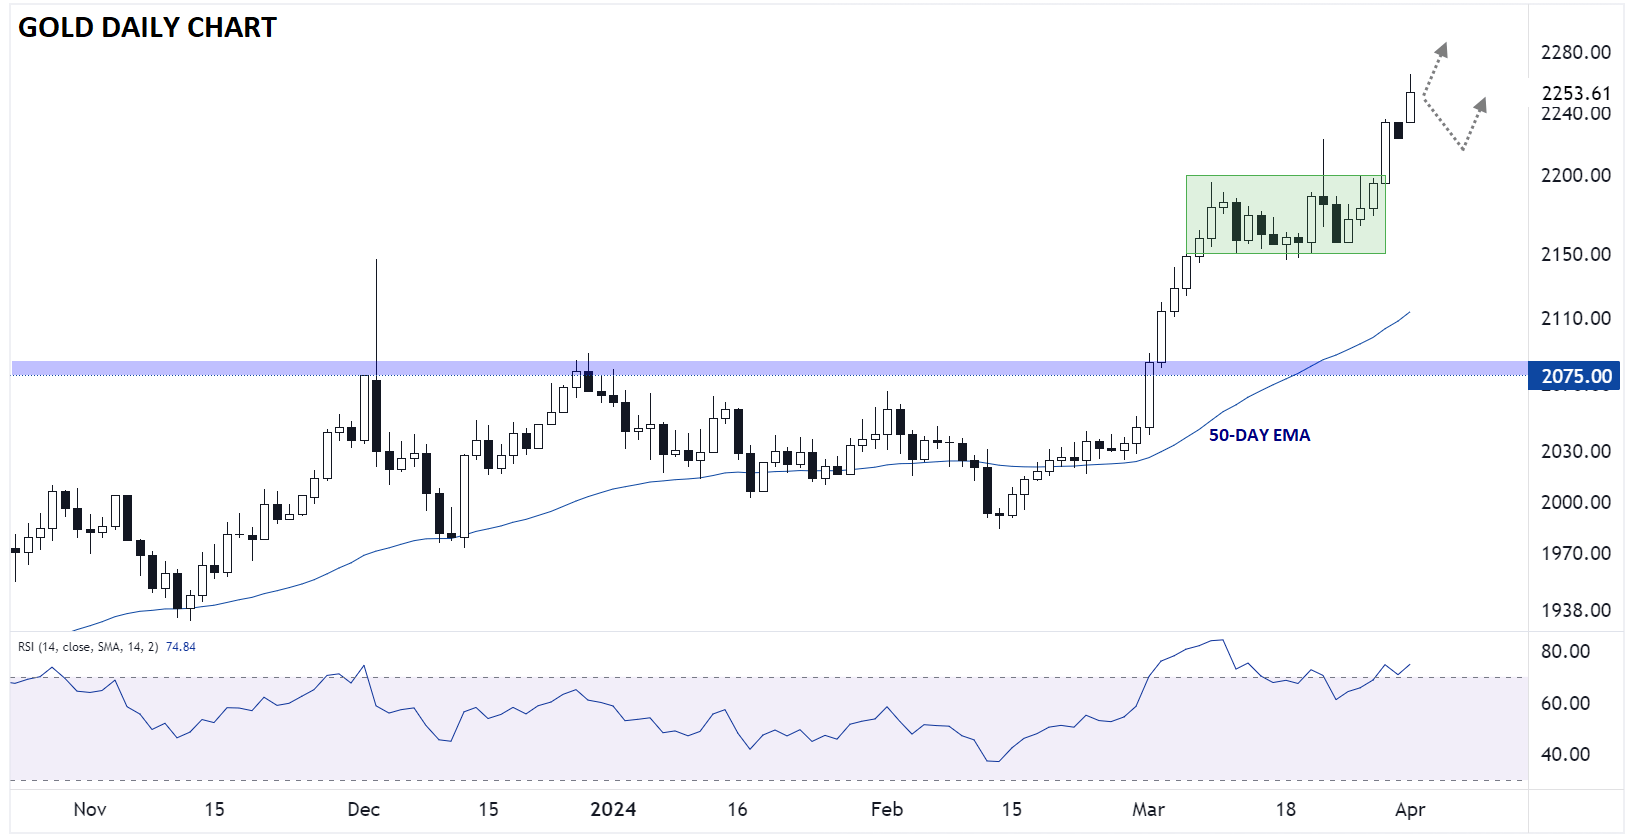
Source: TradingView, StoneX
Turning our attention to the chart, Gold has clearly broken out of March’s 3-week sideways range between $2150 and $2200, hinting at the potential for another leg higher from here. For now, the near-term bullish momentum will remain the dominant feature of the chart as long as prices hold above previous-resistance-turned-support at $2200, and with prices already at record highs, there’s little in the way of meaningful resistance until above $2300.
-- Written by Matt Weller, Global Head of Research
Follow Matt on Twitter: @MWellerFX
Latest market news
Yesterday 01:32 PM
Yesterday 09:35 AM
Yesterday 07:23 AM
Yesterday 04:48 AM
Yesterday 12:17 AM
July 25, 2024 10:39 PM
Latest Gold articles

July 25, 2024 05:30 AM

July 23, 2024 05:20 PM
July 23, 2024 03:17 AM

July 22, 2024 03:16 PM