


- FTSE analysis: Why has UK 100 struggled?
- Top-tier Chinese, UK and US data could ignite momentum
- FTSE technical analysis suggests bulls still clinging on

After a slightly firmer start, the FTSE turned lower in a relatively quiet trade. A sell-off in luxury and bank stocks meant that the UK index would spend at least the first part of Monday’s session in the red. There’s not much in the way of US data in the afternoon, with banks there closed in observance of Martin Luther King. We will, however, have some important macro data from the UK, as well as China and the US, to look forward to later this week, which could impact the FTSE outlook, following its subdued start to the new year.
FTSE analysis: Why has UK 100 struggled?
The FTSE has been hit from multiple sources. Banks have provided one of the biggest drags on the index. Concerns over reduce demand for loans owing to very high interest rates and has held back shares of UK lenders. Meanwhile, there are concerns about demand in the luxury goods industry. Investors fear that margins for luxury goods companies could be squeezed by weaker demand, especially from China where the local stock market has been the weakest among the major economies last year. One of the worst-hit stocks has been Burberry, whose shares have fallen about 10% since it delivered a profit warning on Friday. Let’s see how other luxury companies have performed, with results from the likes of Richemont due out on Wednesday.
On a more macro level, the Bank of England has remained in the hawkish camp, owing to the relatively higher inflation in the UK than other major economies. This is an additional reason why the FTSE has struggled.
Looking ahead to the rest of the week
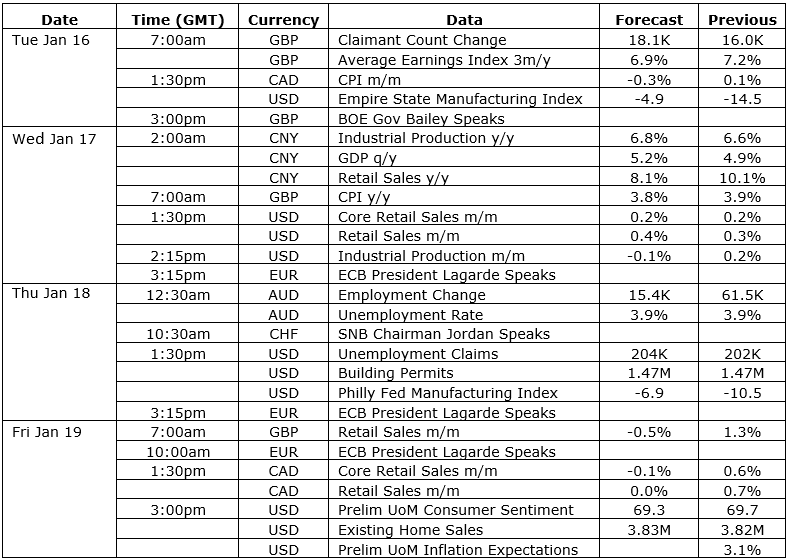
Thankfully, we will have some important UK wages, inflation and retail sales data for December coming up this week, which should provide more clarity on potential interest rate cuts from the Bank of England. We will also awaiting key industrial and GDP data from China on Wednesday, which could help alleviate the downward pressure on Chinese stocks, and in turn support some of the China-focused stocks listed in London. Meanwhile, this week’s US data highlights include retail sales and consumer confidence.
FTSE analysis: technical levels to watch
The FTSE’s side-ways price action in recent weeks means that the levels we have been watching from before, remain pretty much the same. The area around 7550 to 7580 is key support. Here, the 200-day average and a bullish trend line converge with previous horizontal support and resistance. For as long as this zone is defended by the bulls, the trend would remain bullish. Short-term resistance is seen around 7640-7650 area, where Friday’s recovery stalled. Here, the 21-day exponential average also comes into play. The bulls would therefore like to see a close above 7640/50 area in the next couple of days to start gaining back some control.
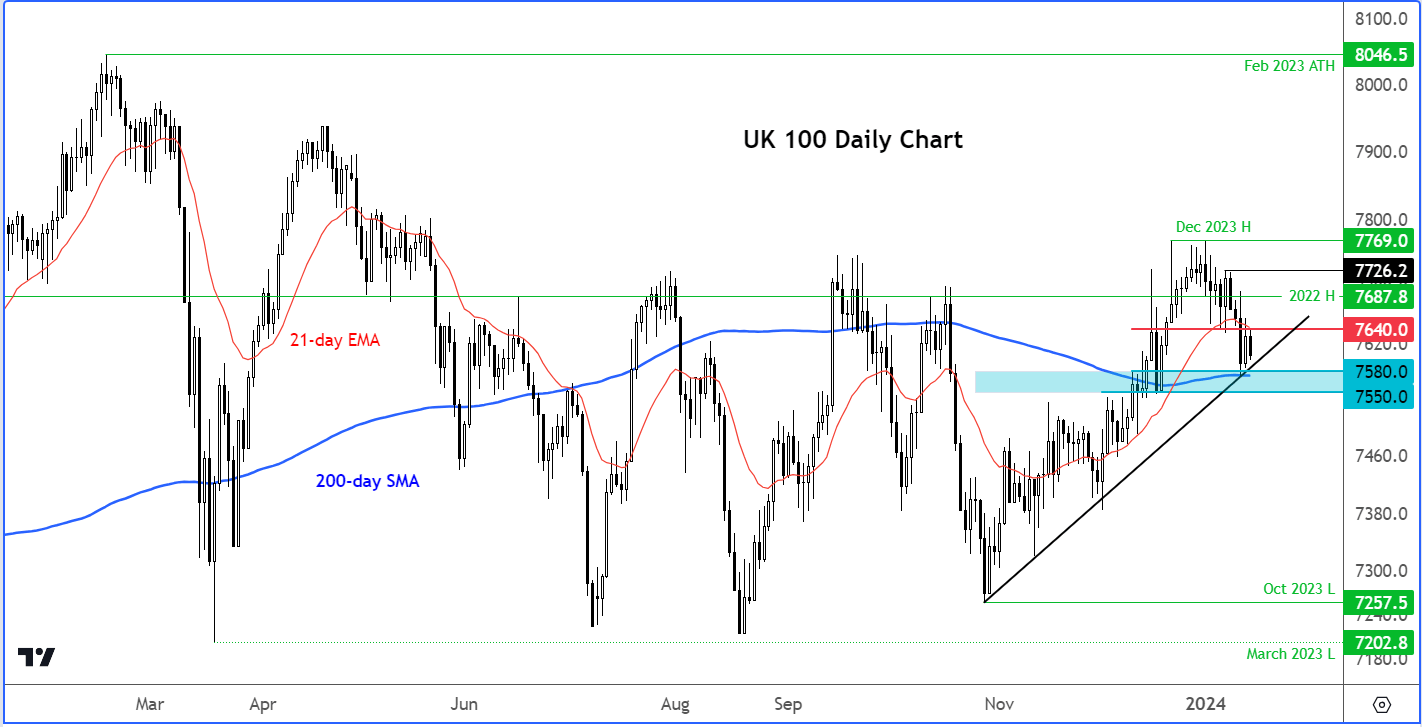
Source: TradingView.com
-- Written by Fawad Razaqzada, Market Analyst
Follow Fawad on Twitter @Trader_F_R
How to trade with City Index
You can trade with City Index by following these four easy steps:
-
Open an account, or log in if you’re already a customer
• Open an account in the UK
• Open an account in Australia
• Open an account in Singapore
- Search for the company you want to trade in our award-winning platform
- Choose your position and size, and your stop and limit levels
- Place the trade
Latest market news
Yesterday 01:32 PM
Yesterday 09:35 AM
Yesterday 07:23 AM
Yesterday 04:48 AM
Yesterday 12:17 AM
July 25, 2024 10:39 PM
Latest FTSE articles

July 16, 2024 08:52 AM

July 15, 2024 11:40 AM

July 11, 2024 08:49 AM

July 5, 2024 08:05 AM