


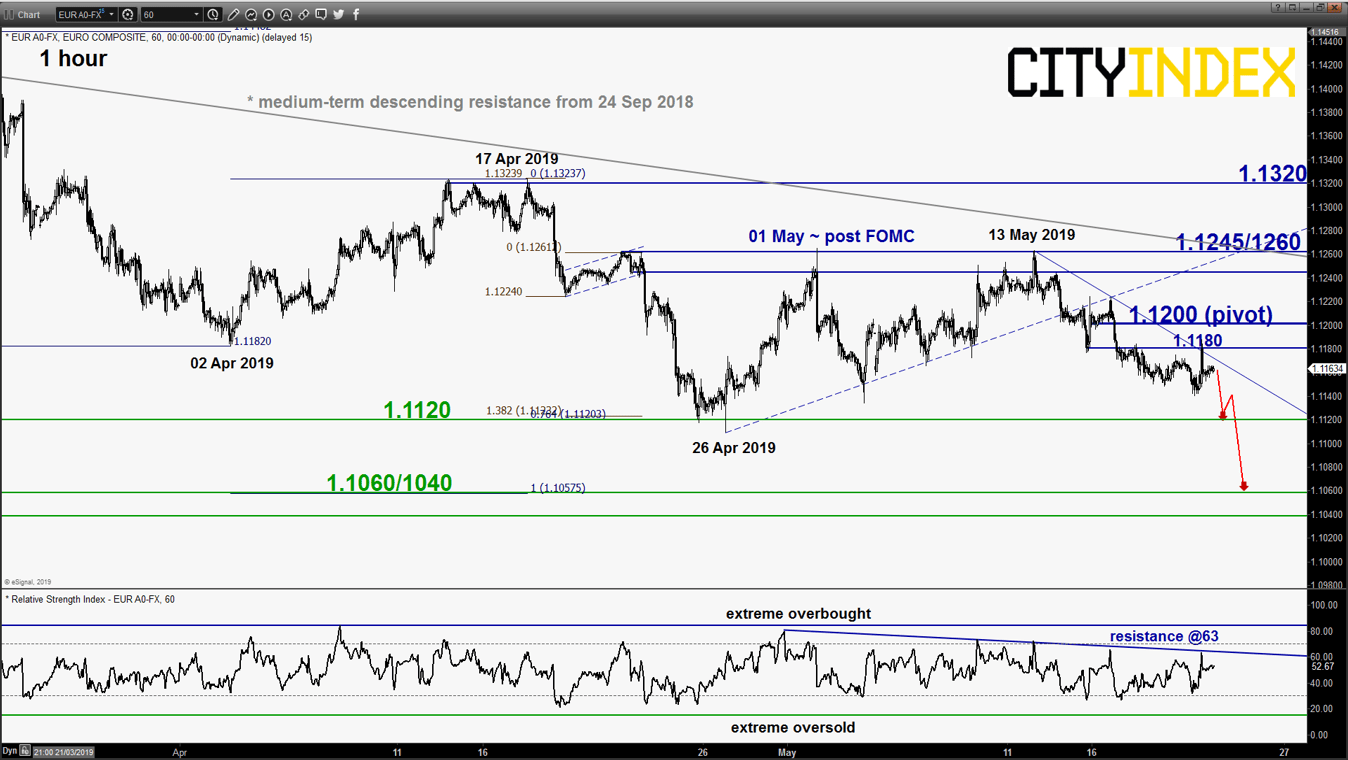
EUR/USD – 1.1200 remains the key resistance to watch
click to enlarge chart
- The earlier bounce of 40 pips+ from yesterday, 21 May European session low of 1.1140 triggered by UK PM May’s announcement of a new parliament vote on her Brexit deal packaged with a vote to call for a second reference had stalled right at the 1.1180 intermediate resistance as per highlighted in our previous report (click here for a recap).
- Short-term technical elements remain negative. Thus, maintain bearish bias with 1.1200 as the key short-term pivotal resistance for push down to retest 1.1120 and a break below it opens up scope for a further potential decline to target the next near-term support at 1.1060/1040 (Fibonacci retracement/expansion cluster).
- However, a break with an hourly close above 1.1200 negates the bearish tone for a corrective bounce towards 1.1245/1260 (range resistance in place since the recent FOMC meeting held on 01 May).
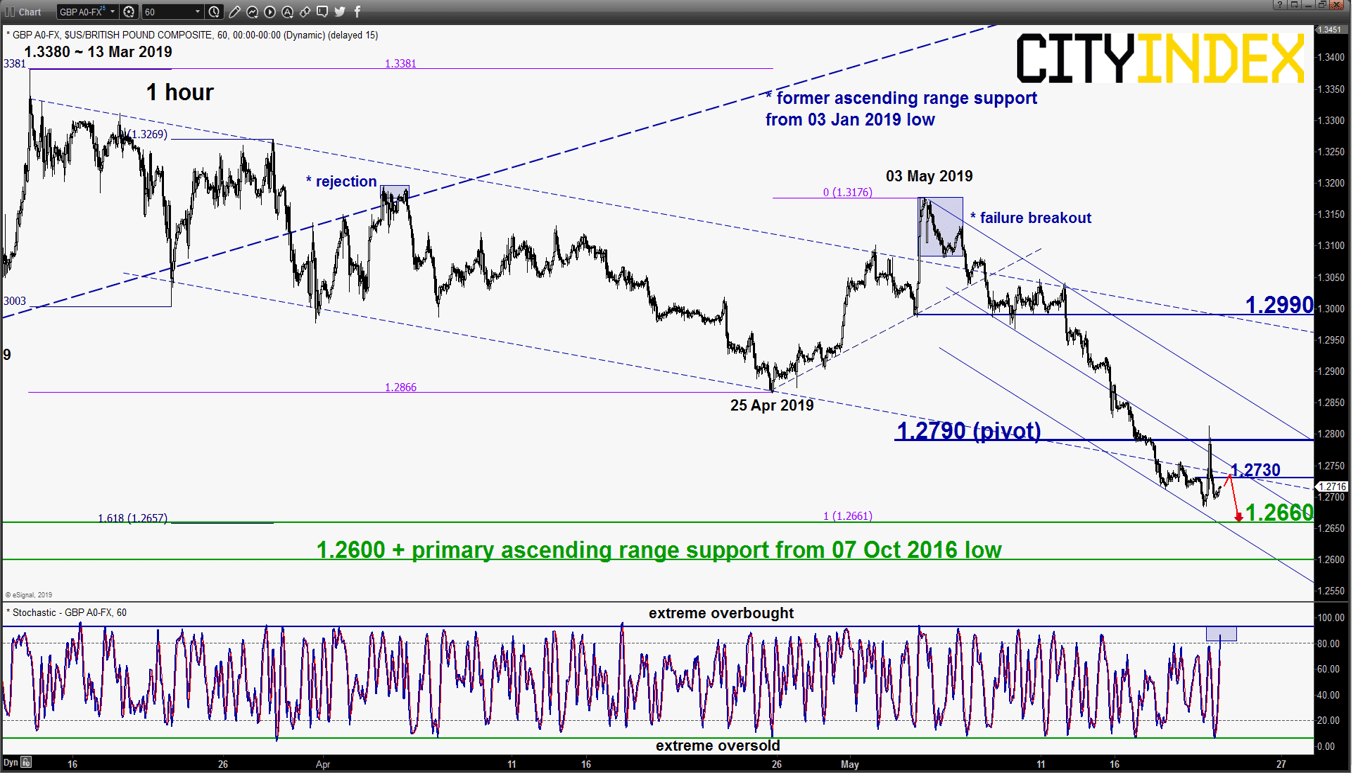
GBP/USD – Bounce stalled at 1.2790 key resistance
click to enlarge chart
- The earlier bounce triggered by UK PM May’s announcement for a new parliamentary vote on her Brexit deal had stalled and reversed right at the 1.2790 key short-term pivotal resistance as per highlighted in our previous report without an hourly close above it (printed an intraday high of 1.2814). Maintain bearish bias with 1.2790 remains as the key short-term pivotal resistance for further push down to target 1.2660 (also the 76.4% Fibonacci retracement of the multi-month up move from 03 Jan 2019 low to 13 Mar 2019 high) with a maximum limit set at 1.2600 (also the primary ascending range support in place since 07 Oct 2016 low).
- However, a break with an hourly close above 1.2790 invalidates the bearish scenario to kickstart a corrective rebound sequence towards the next intermediate resistance at 1.2990 (former minor swing low areas of 03/10 May 2019 & the upper boundary of the descending channel from 13 Mar 2019 high)
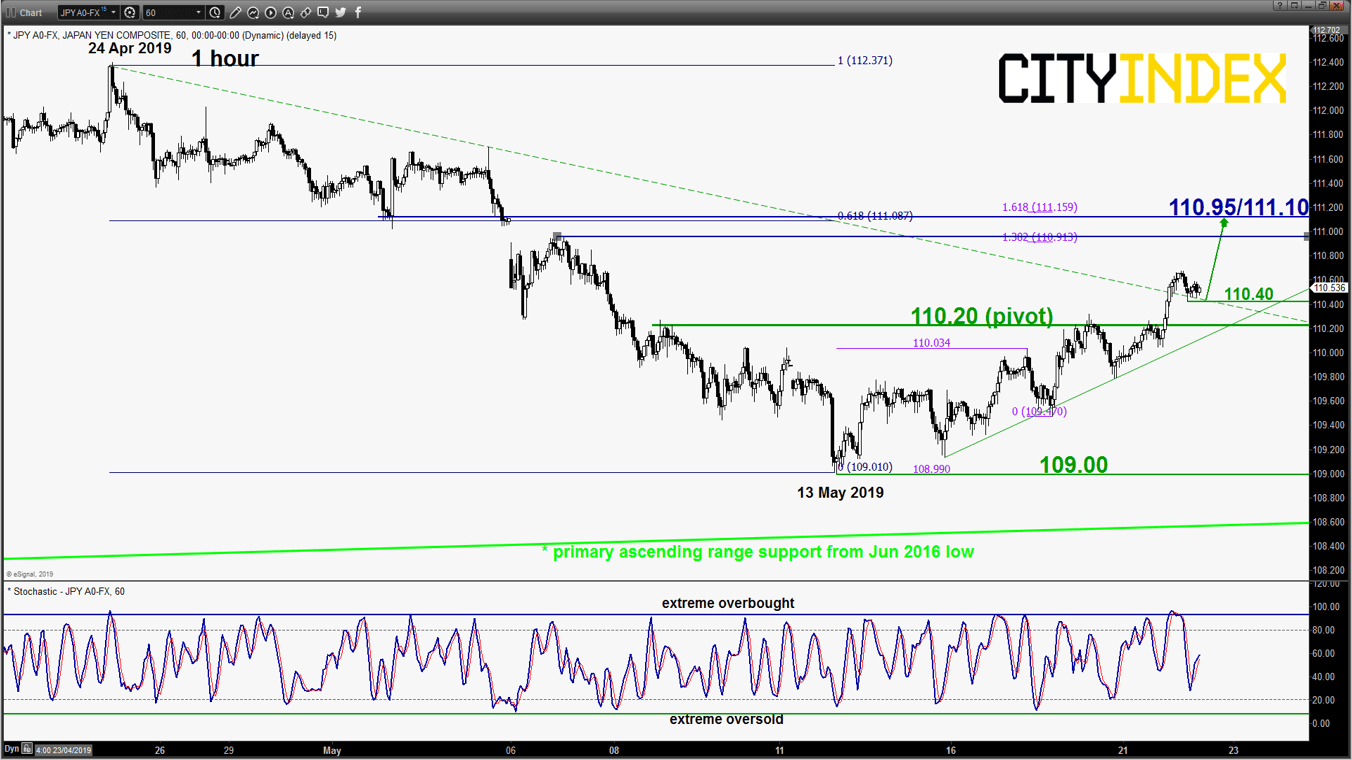
USD/JPY – Corrective rebound in progress
click to enlarge chart
- Broke above the 110.35 upper limit of the short-term neutrality zone as per highlighted in our previous report. Thus, the corrective rebound scenario has been validated with key short-term support now at 110.20 (also the minor ascending trendline from 15 May 2019 low) for a further potential push up to target the next intermediate resistance at 110.95/111.10 (the gapped down formed on 06 May 2019 & a Fibonacci retracement/expansion cluster).
- However, failure to hold 110.20 with an hourly close below it revives the bearish tone for a slide to retest the 13 May 2019 swing low of 109.00 in the first step.
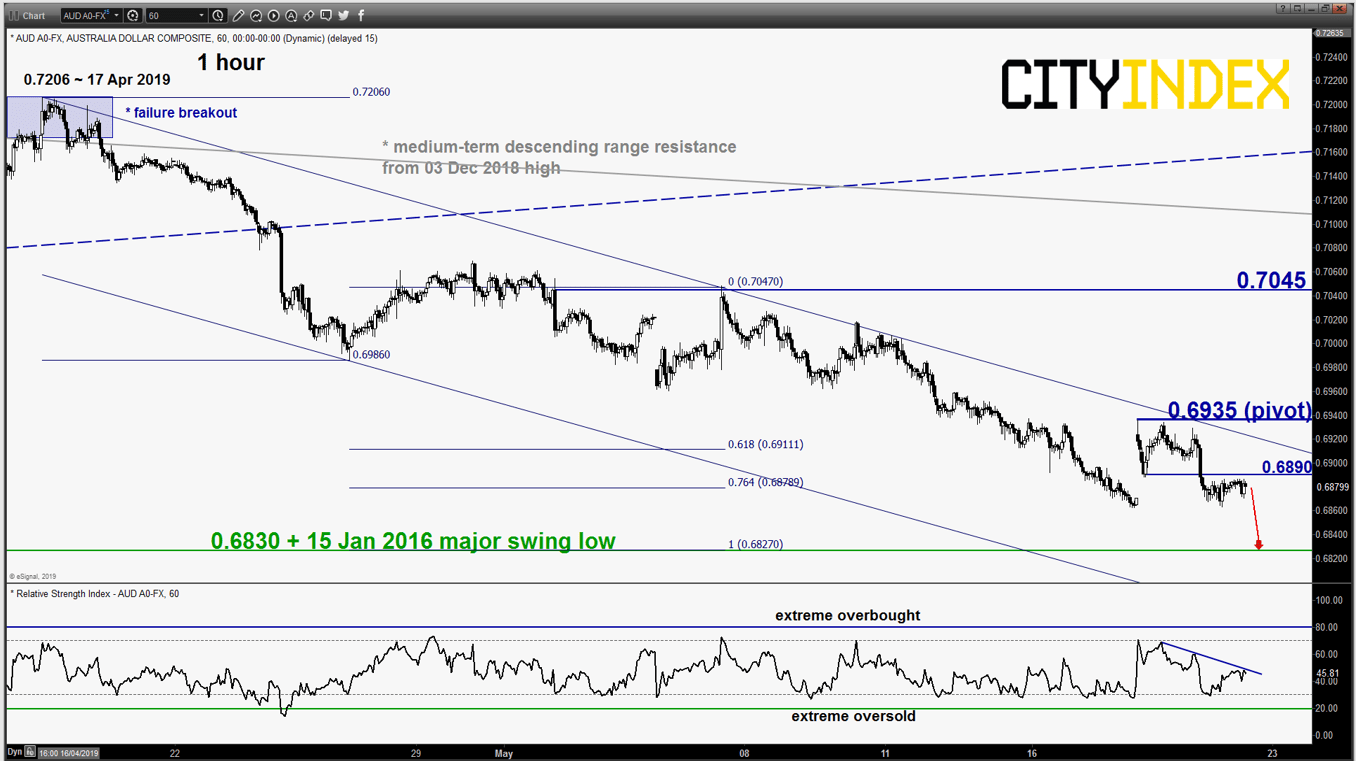
AUD/USD – Further slide remains in progress
click to enlarge chart
- Inched down lower as expected to retest last Fri, 18 May low of 0.6865 that had wiped out the entire post AU election gains. Maintain bearish bias with adjusted key short-term pivotal resistance at 0.6935 for a further potential slide to target the significant support at 0.6830 before risk of a corrective rebound occurs.
- However, a break with an hourly close above 0.6945 invalidates the bearish scenario to kickstart the corrective rebound sequence towards the next intermediate resistance at 0.7045 (formed after the recent RBA meeting on 07 May).
Charts are from eSignal
Latest market news
Yesterday 01:32 PM
Yesterday 09:35 AM
Yesterday 07:23 AM
Yesterday 04:48 AM
Yesterday 12:17 AM
July 25, 2024 10:39 PM
Latest Forex articles

Yesterday 12:17 AM

July 25, 2024 10:39 PM

July 25, 2024 03:59 PM

July 25, 2024 04:37 AM