


August 24, 2022 4:51 AM

Founded in 1996, Appen Limited is the global leader in developing high-quality datasets used to build and continuously improve artificial intelligence (AI) systems.
Data types can include speech and natural language data, image and video data, text and alphanumeric data and relevance data to improve search and social media engines. It reports its half-year numbers tomorrow, Thursday, August 25.
In February, Appen signed off on its FY2021 results. It reported an 8% increase in revenue to US$447.3m (all figures are in U.S dollars). However, its underlying NPAT fell 20% to $28.5m.
The market had been expecting a hit to Appen’s earnings after a move by Apple to allow iOS users to block the app tracking technology that allowed Facebook and other tech giants to target advertising. But that didn’t stop the share price plunging by 28.7% to $6.11 on the day of the report.
The rout has continued into the first half of 2022. After another tough month July, Appen provided a trading update in early August. The update flagged a first-half revenue drop of 7 per cent to $182.9m due to weaker digital advertising demand and a slowdown in spending from some of its largest customers. It also flagged an underlying NPAT loss of $3.8 million, compared to a $12.5 million net profit after tax in 1H FY21.
Management noted that they were “reviewing all investments in the business to accelerate productivity improvements and margin expansion.” However, with scant details on how management would achieve this, the market sent the share price 27% lower from $5.71 to close at $4.15.
Appen Share Price Chart
After falling from a high of $43.66 in August 2020, the share price of Appen is trading back at levels it last traded in 2017, just above $4.00.
Heading into tomorrow’s report, the share price of Appen has spent the past three weeks delicately poised, range trading between $4.00 on that downside and $5.00 on the upside.
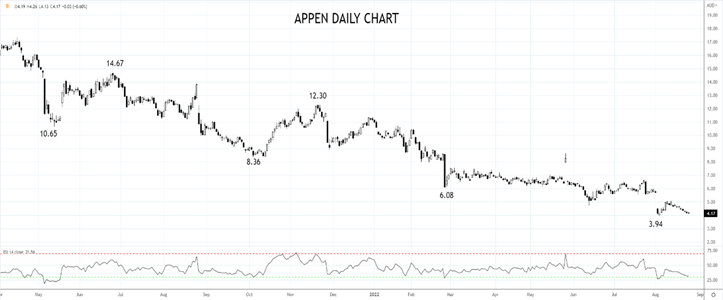
Source Tradingview. The figures stated are as of August 24, 2022. Past performance is not a reliable indicator of future performance. This report does not contain and is not to be taken as containing any financial product advice or financial product recommendation.
How to trade with City Index
You can trade with City Index by following these four easy steps:
-
Open an account, or log in if you’re already a customer
• Open an account in the UK
• Open an account in Australia
• Open an account in Singapore
- Search for the company you want to trade in our award-winning platform
- Choose your position and size, and your stop and limit levels
- Place the trade
Latest market news
Yesterday 01:32 PM
Yesterday 09:35 AM
Yesterday 07:23 AM
Yesterday 04:48 AM
Yesterday 12:17 AM
July 25, 2024 10:39 PM
Latest Australia 200 articles


February 15, 2024 11:33 PM

February 15, 2024 01:42 AM

February 14, 2024 05:39 AM