


Market Summary:
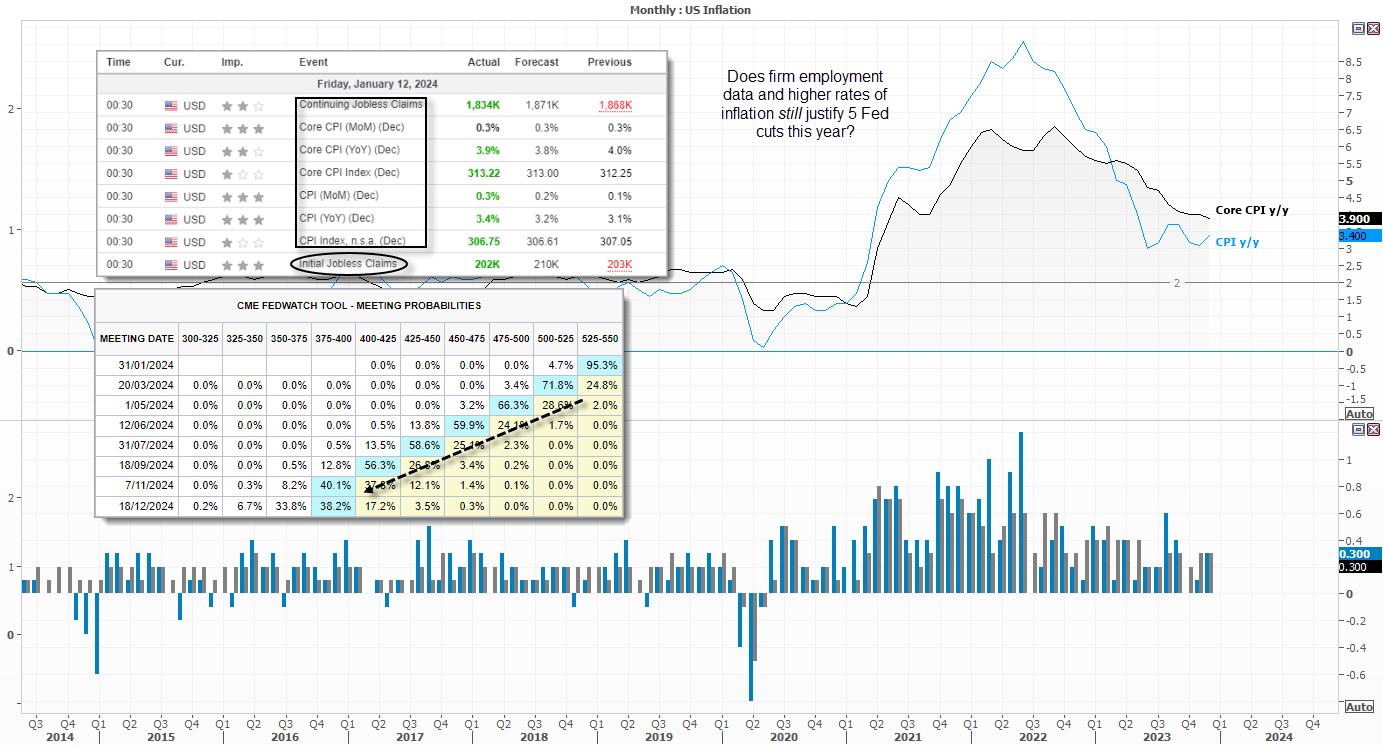
Once again, we see a disparity between market pricing, data and the Fed’s narrative. At 0.3% m/m, US core and headline inflation were slightly above their long-term averages which helped pushed the annual rates above estimates at 3.4% and 3.9% y/y respectively.
Given the strong labour market, five Fed cuts seems overly optimistic unless the wheels to the US economy truly fall off. And until employment data takes a serious hit, the Fed won’t be bullied into aggressive hikes with inflation at these levels – or feel inclined to cut by more than the 75bp indicated in the dot plot.
Even so, Fed Fund futures still imply a 70% chance of a 25bp cut in March and five cuts this year despite Fed’s Mester pushing back on any early easing. And the US dollar didn’t behave in such a way to suggest USD bears are running scared. EUR/USD closed effectively flat and volatility levels across FX markets were relatively low.
However, US treasury yields continued to fall which helped Wall Street recover most of its early losses. And that could be a combination of bond traders calling ‘bulldust’ on the US economy and the growing concerns over a regional conflict in the Middle East. But looking across key markets, my guess is few got what they wanted in terms of market reaction from this month’s CPI report.
- Gold once again recovered back above $2020 following a false, intraday break beneath it
- The S&P 500 briefly traded above the December high ad remains within easy reach of its all-time high
- The Dow Jones remains at the top of its consolidation around its record high
- The Nasdaq 100 trades less than 1% from its record high
- Forex major pairs were mostly flat and volatility was relatively low relative to the event
- ECB president Lagarde warned that the re-election of Trump could “would represent a threat for Europe”
- A rise in Australian coal exports saw their trade surplus rise to A$11.4 bn in November, with exports rising 1.7% and imports down -7.9%
Events in focus (AEDT):
- 09:00 – Australian
- 10:50 – Japan’s current account, bank lending, foreign bond/stock purchases
- 11:30 – Australian loans
- 12:30 – China CPI, PPI
- 14:00 – China trade balance
- 18:00 – UK GDP (m/m, y/y), index of services, industrial production, manufacturing production, trade balance
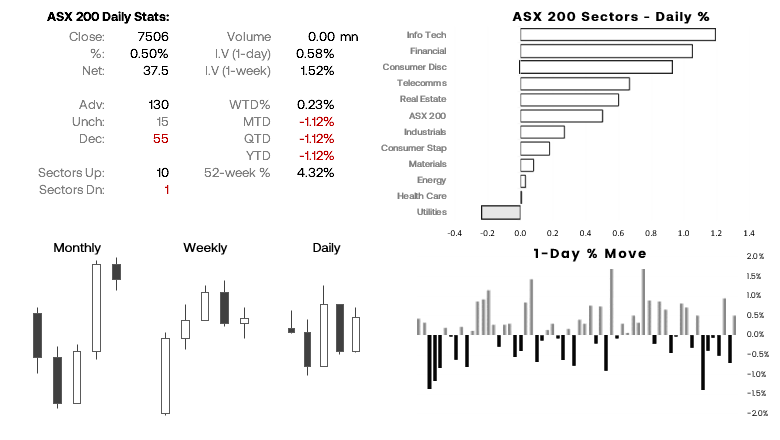
ASX 200 at a glance:
- The ASX 200 held above the July ‘double-top’ high and formed a small bullish inside day
- The 20-day average continues to support the ASX 200
- 10 of its 11 sectors advanced, led by info tech and healthcare (utilities declined)
- Around current prices, the ASX is on track to form a weekly doji around support / July highs
- With Wall Street holding onto gains and remaining near cycle highs, bulls may want to seek dips towards recent lows for near-term long positions
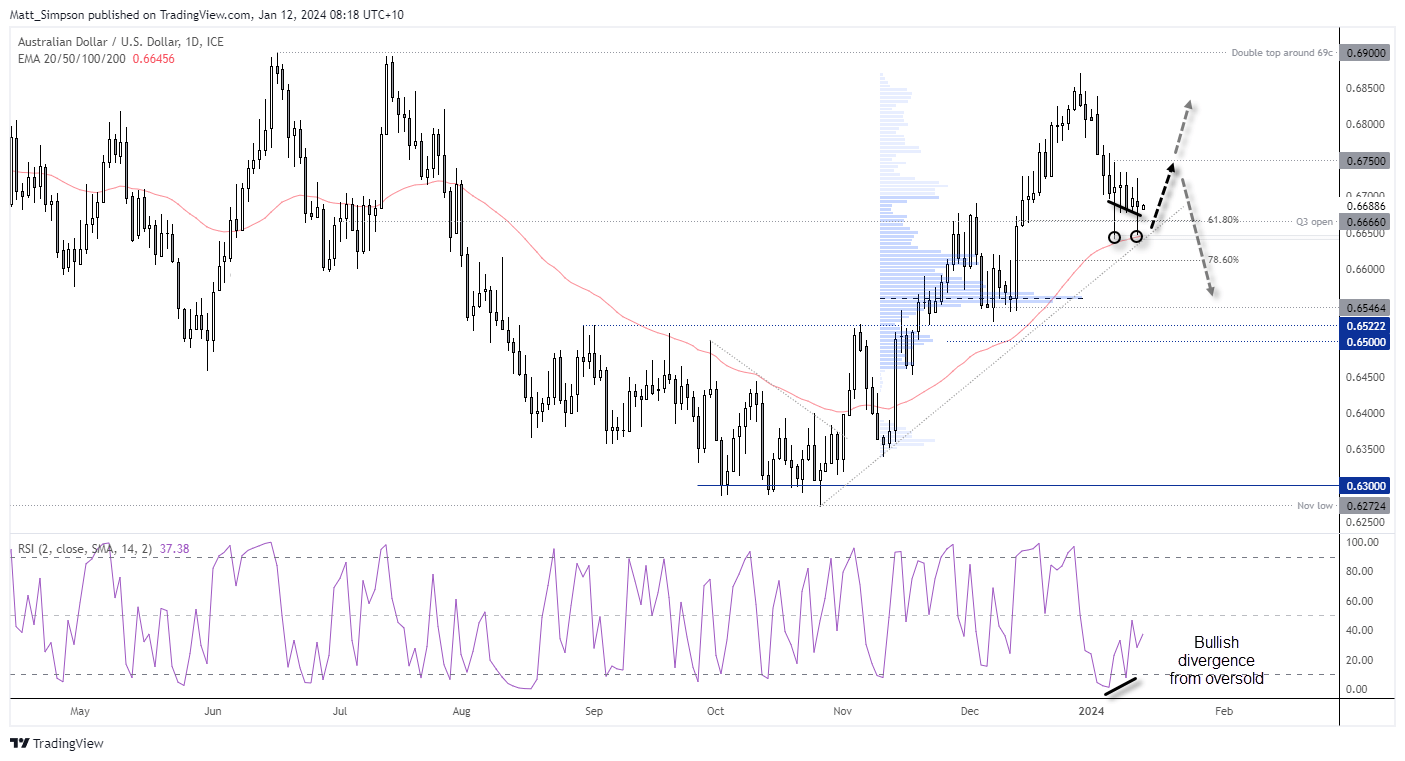
AUD/USD technical analysis (daily chart):
Today’s charts are a good example of when technical, fundamentals and sentiment are not fully aligned. Yet the technicals seem good enough to at least warrant a look for a potential setup.
AUD/USD has seen a decent pullback from its December high and prices are holding above trend support, while the daily closes hold above the Q3 open and 61.8% Fibonacci retracement level. Two long-tailed doji’s have also formed to suggest support resides around 0.66450, and a bullish divergence formed with RSI (2) whilst it was in the oversold zone.
What we’re lacking is a bullish catalyst. Still, as long as prices hold above last week’s low, any low volatility retracement towards it could entice bulls to step in to try and milk a relatively low-risk entry, on the bet that a bullish catalyst may arrive, prices form a swing low and then they’re ‘off to the races. 0.6750 could mark a sensible initial target, a break above which assumes a bullish catalyst has arrived.
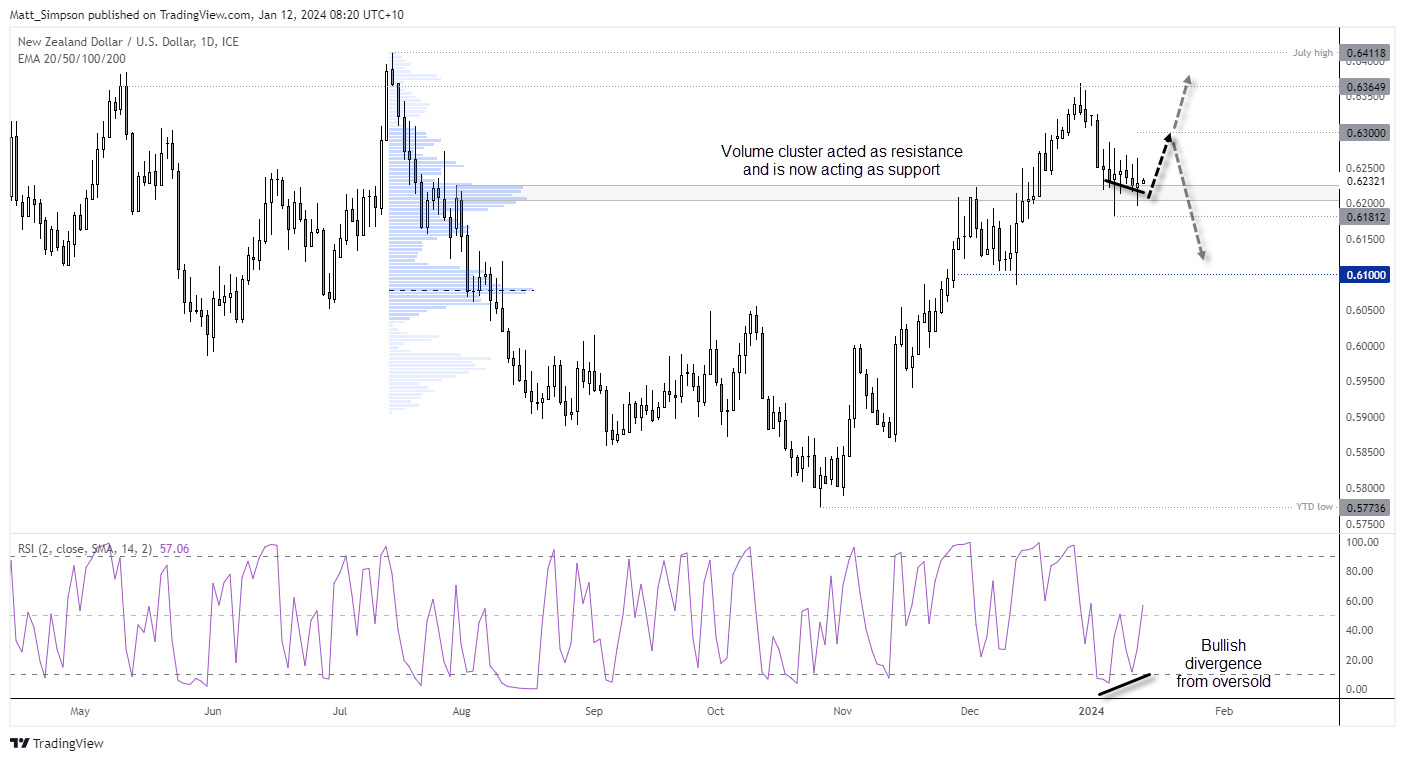
NZD/USD technical analysis (daily chart):
There are of course similarities between AUD/USD and NZD/USD, but out of the two I prefer NZD/USD for longs over the near-term. It has formed the more bullish trend structure on the daily chart, and its pullback from the December high has found support around a prior volume cluster. And if prices were to rally from here, it would have turned resistance into support.
Again, we see a bullish divergence has formed with RSI (2) after it dipped into the overbought zone. The bias remains cautiously bullish whilst prices remain above last week’s low and for bulls to enter upon any low volatility move towards it (and a stop well beneath it). 0.6300 could make a viable bullish target over the near-term.
View the full economic calendar
-- Written by Matt Simpson
Follow Matt on Twitter @cLeverEdge
How to trade with City Index
You can trade with City Index by following these four easy steps:
-
Open an account, or log in if you’re already a customer
• Open an account in the UK
• Open an account in Australia
• Open an account in Singapore
- Search for the market you want to trade in our award-winning platform
- Choose your position and size, and your stop and limit levels
- Place the trade
Latest market news
Yesterday 01:32 PM
Yesterday 09:35 AM
Yesterday 07:23 AM
Yesterday 04:48 AM
Yesterday 12:17 AM
July 25, 2024 10:39 PM
Latest Asian Open articles

July 25, 2024 10:39 PM

July 24, 2024 10:10 PM

July 23, 2024 11:29 PM

July 22, 2024 10:43 PM