


The headline inflation rate for China deflated for the first time since January 2021 at -0.3% y/y. And that’s a big deal with China being a key export nation, as importers and consumers of their trade partners stand to benefit from lower prices. And with lower inflationary pressures overseas, it removes pressure from central banks to continue hiking interest rates (and dare we say, stoke hopes of interest rate cuts). On the other hand, it also points to lower growth for China and the rest of the world. But we are at the point where lower growth is a necessary evil to achieve lower inflation, with central banks aiming for a soft landing over an outright global recession.
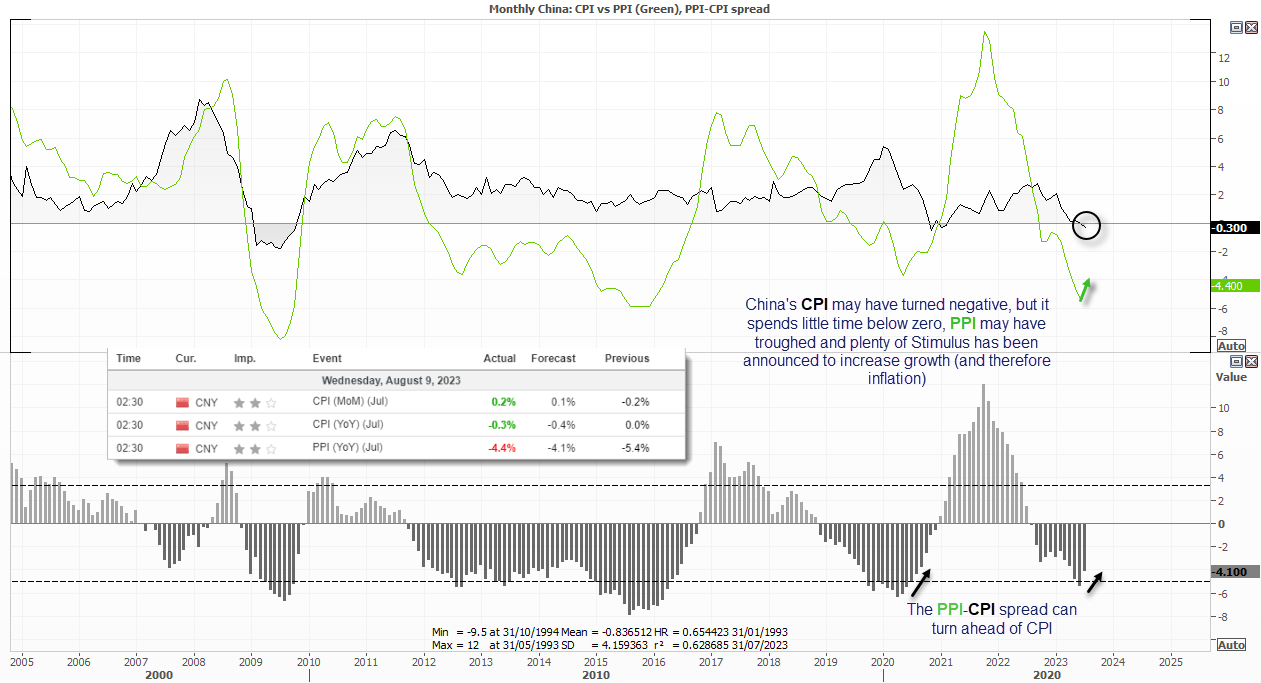
The question now is whether prices will continue to fall and for how long. My concern is that it won’t e very low for very long. If we look back at recent history, China’s inflation rate has spent very little time in negative territory. Their large population and increased demand for goods globally provides a natural level of support for consumer prices. The central authorities also have control over the currency and allow it to slide to boost exports which in turn supports prices, at least to a degree.
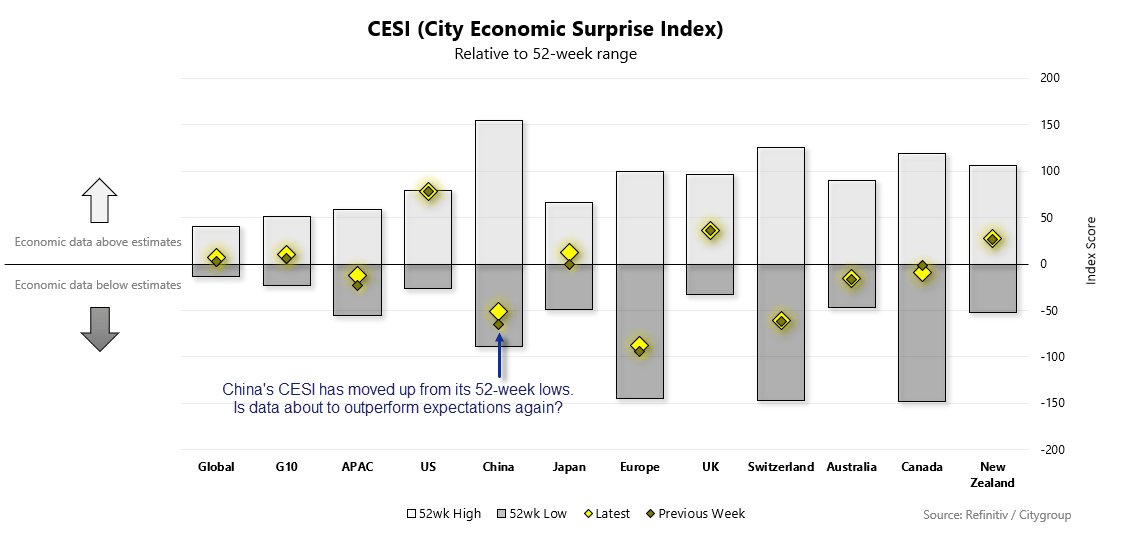
Stimulus is (still) coming, and the CESI points towards an economic trough
But perhaps more importantly are the stimulus measures being made which can provide further support for prices, if not send them higher. The PBOC (People’s Bank of China) has cut interest rates and lowered reserve requirements for banks. The Chinese government has announced plans to cut taxes for businesses and individuals with the intention of boosting consumer spending and investment. Plans have also been announced to increase spending on infrastructure and other projects. Furthermore, the government have also announced plans to invest heavily in green energy to help create jobs and boost economic growth (ahem… while also reducing pollution).
While these are just some of the stimulus measures that China has announced this year, the government is likely to continue to announce more measures in the coming months, as it seeks to boost economic growth and prevent a slowdown. It remains debatable whether these measures will be sufficient to boost the economy back to the "good old days" of 6%+ GDP growth.
However, it is possible that China's economy will outperform weak expectations and send inflation higher as we head into 2024. And that could prevent central banks from cutting interest rates sooner than later, as markets so desperately want.
If we look at the CESI (Citigroup Economic Surprise Index), it has moved up form its 52-week lows which means economic data has not been as weak as anticipated. Given this index oscillates in clear cycles, we could expect the CESI to revert to positive territory as stimulus measures take effect and help economic data outperform gloomy forecasts.
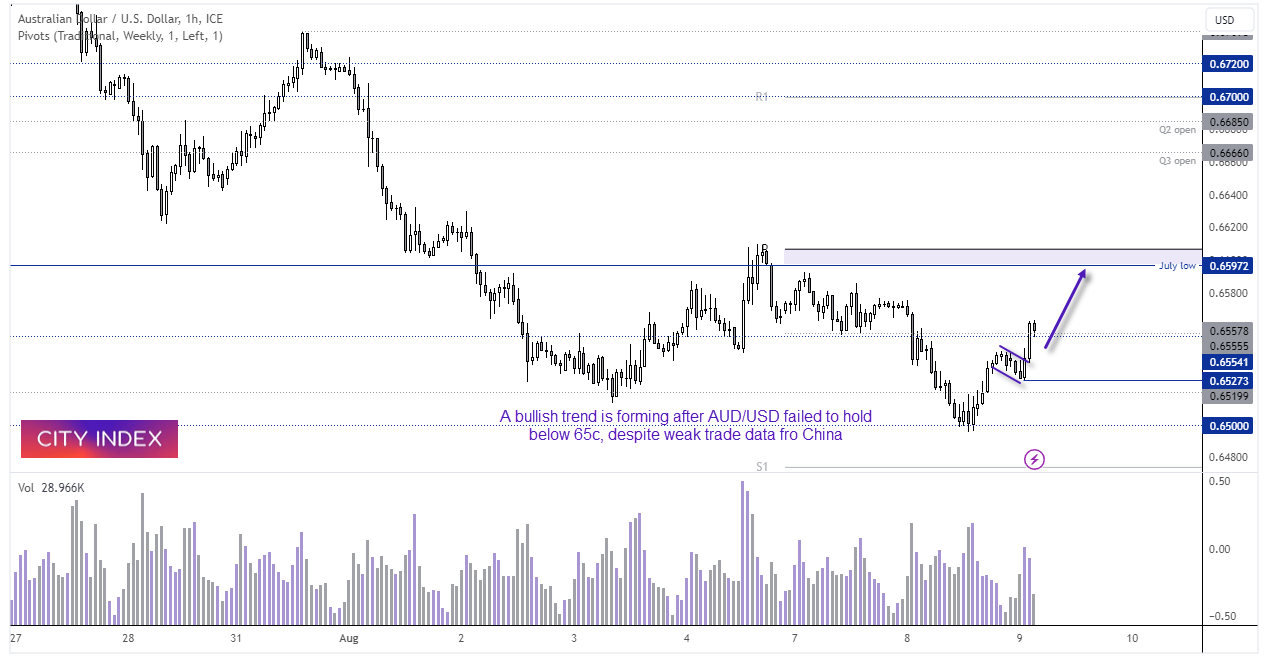
AUD/USD gets a boost from NZ data and stronger yuan
USD/CNH fell around -0.3% following the inflation report, whilst AUD/USD mustered up the energy to rise 20-pips - presumably on hopes of a weaker US inflation report. News that New Zealand’s 1-year CPI expectation ha risen 4bp provided AUD/USD with another move higher, following its breakout from a bullish flag pattern on the 1-hour chart. From here, it remains plausible that AUD/USD has seen a spike low around 65c following weak trade data from China on Tuesday and now headed for the July low.
US inflation will be a key driver for markets in general, and AUD/USD will be no exception. We need to factor in the ‘basing effect’ which may see inflation levels in the US rise, but I have made the assumption that this has been accounted for in forecasts. We may need to see US inflation come in lower than expectations to send AUD/USD materially higher this week, but of course CPI lower than previous would be ideal.
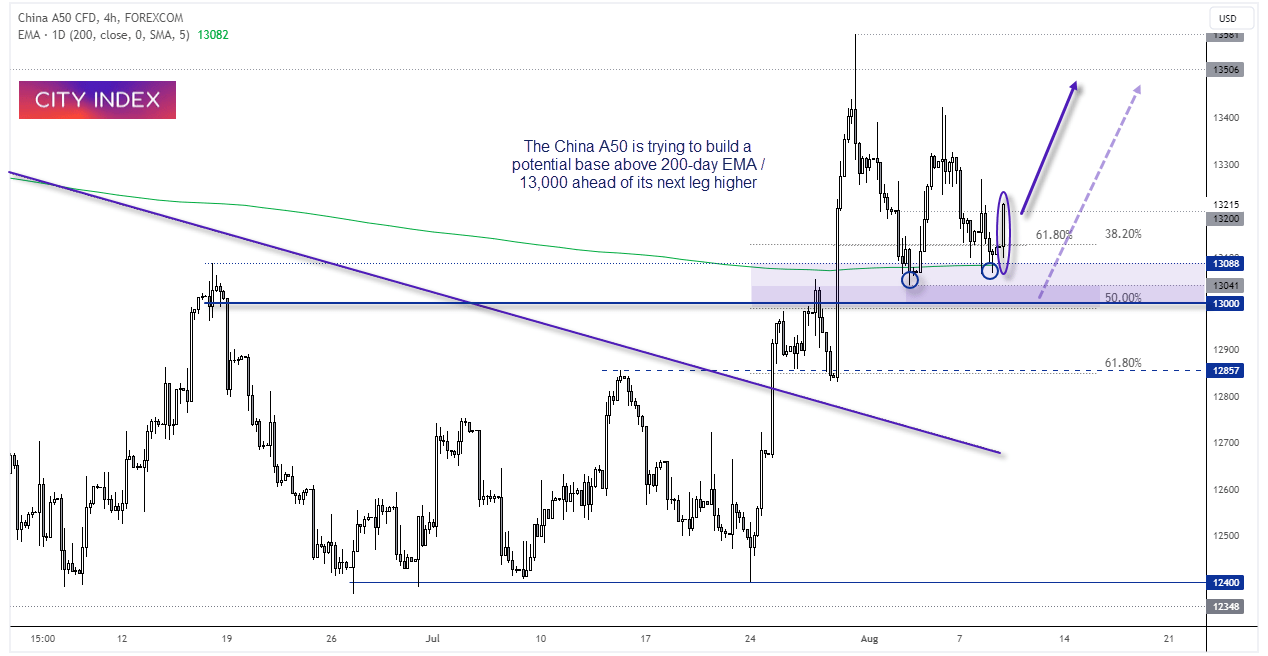
China A50 4-hour chart:
The China A50 posted a strong rally in the last full week’s trading of July and is now within its second week of its retracement. I highlighted my bullish bias late July, noting its reluctance to break beneath 12,400 despite all of the negative sentiment surrounding China’s economic data. We’ve since seen the break of trend resistance, and a base is building around the 200-day EMA.
The 4-hour chart shows a potential double bottom around the 200-day EMA and 61.8% and 32.8% Fibonacci levels. That its also holding above 13k adds extra weight to the bias for another leg higher from here. We can see on the 1-hour chart that prices have popped higher, so perhaps we’re witnessing the early stages of its next leg higher. A break below 13,000 will quickly invalidate that bias.
-- Written by Matt Simpson
Follow Matt on Twitter @cLeverEdge
How to trade with City Index
You can trade with City Index by following these four easy steps:
-
Open an account, or log in if you’re already a customer
• Open an account in the UK
• Open an account in Australia
• Open an account in Singapore
- Search for the market you want to trade in our award-winning platform
- Choose your position and size, and your stop and limit levels
- Place the trade
Latest market news
Today 11:05 AM
Today 10:46 AM
Today 05:56 AM
Latest Trade Ideas articles

Today 11:05 AM


Today 05:56 AM

Yesterday 11:57 PM