


- WTI technical analysis: After last week’s hammer candle, today’s upside follow through would appease the bulls
- Crude oil prices turn sharply higher as BP pauses all Red Sea oil shipments after rebel attacks
- WTI has likely formed a bottom after bouncing from its 200-week average
Crude oil prices recovered from earlier weakness and turned sharply higher by mid-day in London. The gains follow last week’s first positive close in seven, as more signs emerge that oil prices have finally found a bottom. Helping to fuel today’s rally was news concerning the situation in the Red Sea. Several freight firms have suspended journeys through the strait as the attacks continue from Houthis on vessels en route to Israel. This has resulted in many companies redirecting cargoes around the south coast of Africa, increasing the shipping costs for oil exporters. Oil giant BP said it is pausing all shipments of oil through the Red Sea because of the "deteriorating security situation" in the region.
Crude oil closed last week in the positive territory for the first time after 7 consecutive weekly falls. Prices finally found some support as demand concerned eased. At the start of the new week, oil prices have recovered after falling nearly 1% earlier in the session, before rising sharply on the back of those Red Sea headlines. Initially, the weakness had created some doubts over bullish signals that had emerged last week. But the bulls would be relieved to see dip-buyers coming in to support prices this early in the week, validating the bullish reversal signs in oil prices from last week.
Before discussing the macro factors further, let’s start of by looking at the charts first.
WTI Technical analysis: Weekly hammer candle and follow-thru are bullish signals for oil
Even before today's impressive recovery, last week's price action had hinted that we might have hit a low in oil prices, judging by the technical signals that were created and I am about to go through. So, today's rally is more or less confirming that turnaround, assuming the gains stick until the close. If we can ignore the fact today’s rally was trigged by the Red Sea situation, the strong rally looks even more upbeat, considering the shaky start for oil earlier in the day.
Let’s have a quick look at WTI's weekly chart:
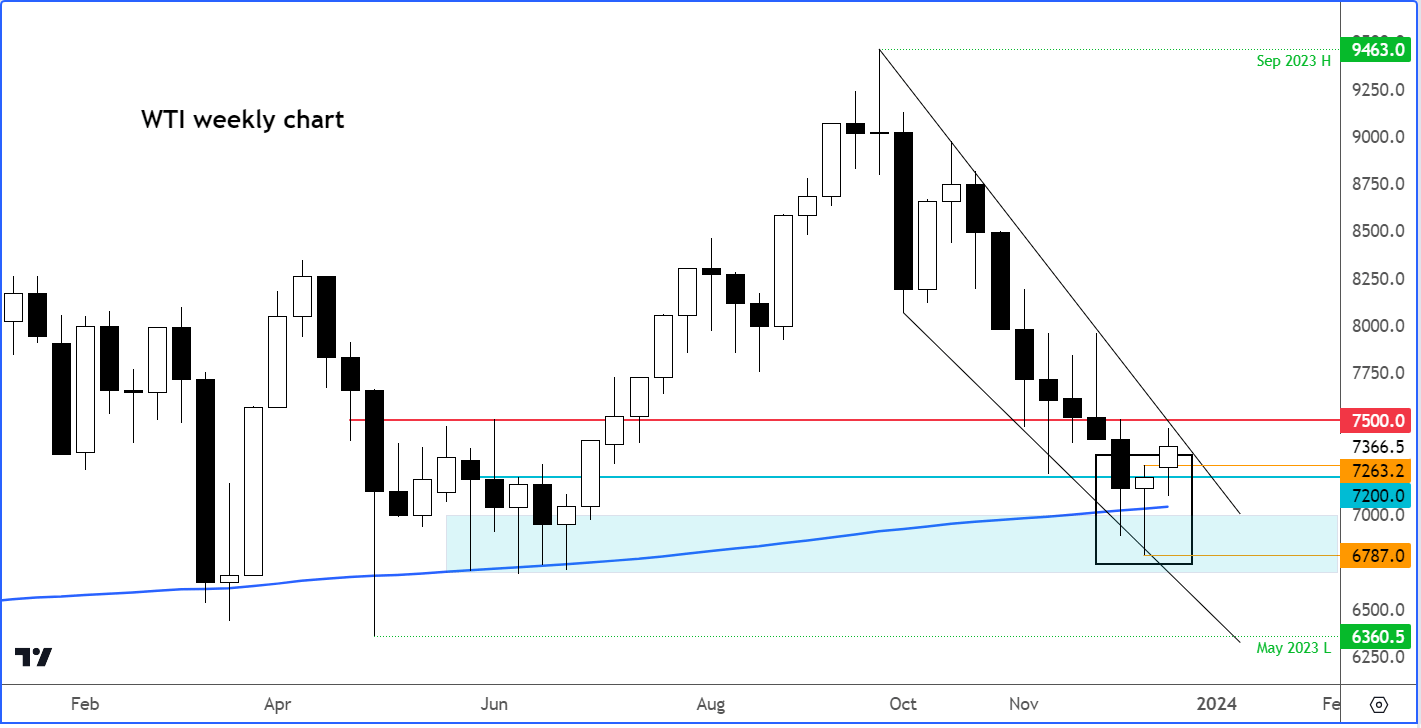
The most obvious thing on the chart should be the hammer candle formed last week. The hammer is a bullish reversal signal, usually showing up at the end of a downtrend. Among the characteristics of the hammer, the opening price is usually below the close, and there's a long wick extending lower, at least twice the size of the shorter candle body. In simple terms, this pattern often preceded more gains, signaling a shift from selling pressure to buying pressure – and that seems to be what's happening now.
The reversal kicked in last week as oil prices dipped over $2 below the critical $70 mark but closed the week about $2 above it, which is a big deal for momentum traders. What adds spice to the bullish story is that this hammer candle was formed around the rising 200-week average, making it even more interesting for the bullish camp.
Now, the bulls want to see oil prices hanging above last week's high at $72.63. So far, WTI seems to be holding up well, albeit off its earlier highs as I wrote this.
An ideal scenario now would be for WTI to break through the resistance trend of the bearish channel and take out last week's high at around $75. If that happens, it will create a three-bar bullish reversal pattern.
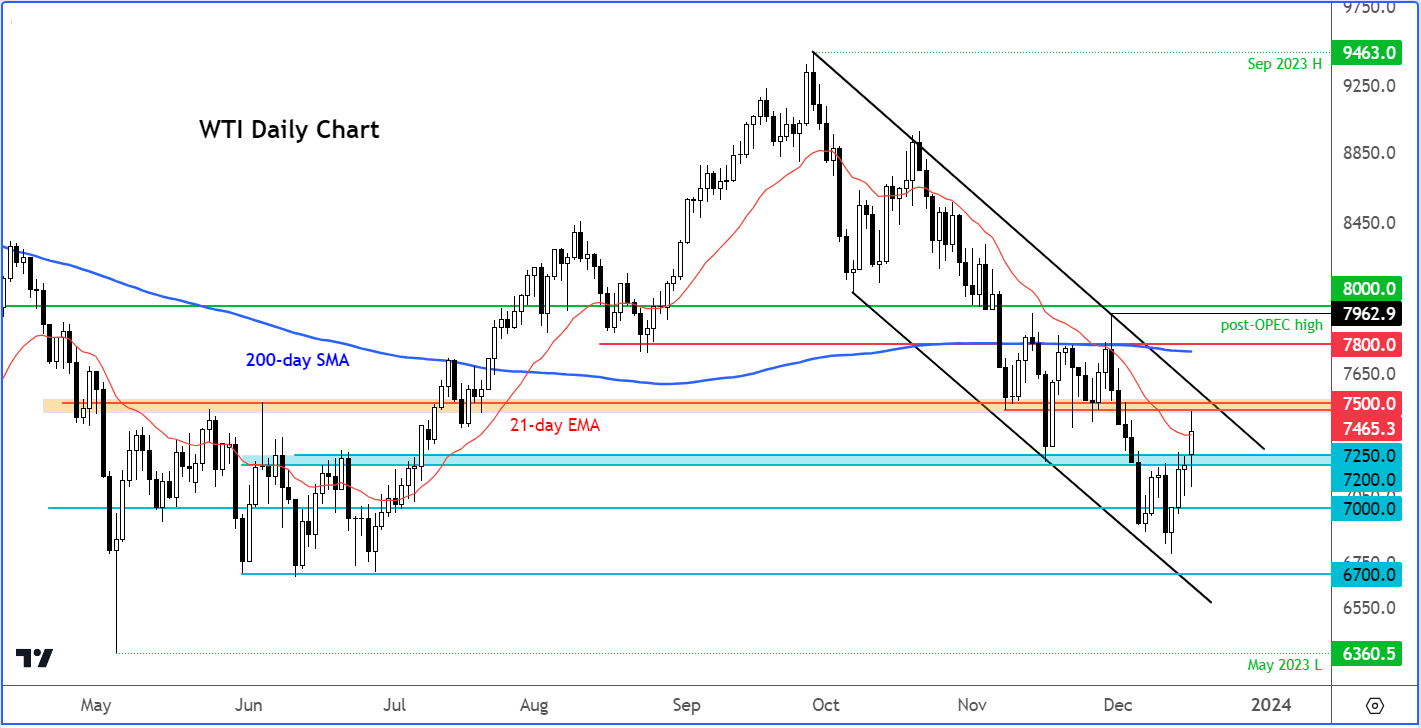
Taking a closer look at the daily chart, we can refine out resistance zone more precisely. The orange shaded area between $74.65 and $75.00, which was previously support and resistance, is where the next area of trouble is. Given the bearish trend since prices peaked in September, it's essential to be cautious while oil hangs around or within this zone.
Considering today's rally and the positive action from last week, there's a chance that oil might have hit rock bottom. To really be sure, we'll need to see support during any short-term dips hold. WTI needs to stay above last week's range to keep the bullish vibe going.
Crude oil analysis: Greater Likelihood of Upward Risks for Prices
An oversold rebound in oil prices was always likely after the big falls in recent weeks. But we are in an overall bullish macro environment for oil. Yes, there are some concerns over demand while the efficacy of the supply cuts from the OPEC+ has come under some scrutiny. But at the very least it looks like the worst of the sell-off may be behind us now, after what has been a brutal couple of months.
The ongoing supply cuts from OPEC and allies should keep the downside limited from here on. If anything, the risks are skewed given the bullish reversal signals from last week’s price action. There are now the increased supply costs to consider as a growing number of oil tankers are halting all sails through the Red Sea strait. BP, Evergreen and Euronav are among those halting sails because insurers are demanding high ‘war risk’ cover.
It's important to note that the recent drop in oil prices may not have been entirely justified, given the demand inelasticity for oil. In this context, the supply side plays a more crucial role. If the OPEC were to implement additional measures to stabilise prices, it could keep prices high. Recent remarks from Saudi Arabia's energy minister hint at the possibility of extending or deepening supply cuts beyond Q1. Russia has also indicated intentions to further reduce oil exports, potentially by 50,000 barrels per day or more.
So, the OPEC+ is making considerable efforts to bolster prices. It would be unwise to bet against their success. Even without further cuts, they are already holding back supplies significantly. As demand rebounds, prices are likely to find support.
Source for all charts used in this article: TradingView.com
-- Written by Fawad Razaqzada, Market Analyst
Follow Fawad on Twitter @Trader_F_R
How to trade with City Index
You can trade with City Index by following these four easy steps:
-
Open an account, or log in if you’re already a customer
• Open an account in the UK
• Open an account in Australia
• Open an account in Singapore
- Search for the company you want to trade in our award-winning platform
- Choose your position and size, and your stop and limit levels
- Place the trade
Latest market news
Yesterday 01:32 PM
Yesterday 09:35 AM
Yesterday 07:23 AM
Yesterday 04:48 AM
Yesterday 12:17 AM
July 25, 2024 10:39 PM
Latest WTI articles

July 25, 2024 05:30 PM

July 18, 2024 12:48 AM

July 10, 2024 03:45 PM
July 9, 2024 05:30 PM