


- Downside momentum in US WTI crude markets is building
- The price action on Wednesday was bearish, seeing the price take out a series of downside levels
- WTI is resting on long-running uptrend support with very little standing between it and a flush towards the mid-$70 per barrel region
WTI crude was looking suspect even before Wednesday’s big swoon, leaving the price teetering on key uptrend support dating back to the Fed’s rate cut pivot in December. Should it give way, there’s not standing between a larger flush to the mid-$70 per barrel region. Central bankers will be watching closely given the implications for inflation and interest rates.
Persistent hopes for a peace deal in the Middle East and a surprise build in US crude inventories were supposedly contributing factors behind the more than 2% drop, seeing the price take out a series of downside levels including the 50 and 200-day moving averages. However, the price action had been anything but convincing in recent weeks, suggesting upside momentum was already starting to falter.
US crude, gasoline inventories build unexpectedly, pressuring WTI.
According to official data released by the US Energy Administration Agency (EIA) on Wednesday, crude inventories jumped by 7.3 million barrels to 460.9 million barrels in the week ended April 26, a big deviation on the more than million barrel draw expected by traders.
Refinery runs eased by 230,000 barrels per day while refinery utilisation rates fell one percentage point to 87.5% of existing capacity, an unusual development relative to seasonal trends.
Downstream inventories were mixed with gasoline stocks rising unexpectedly by 300,000 barrels while distillate stockpiles – which include diesel and heating oil – fell by 700,000 barrels, nearly four-times larger than expected.

But the downside flush looks more than fundamentally-drive
While the EIA data can and does move the crude price often, the scale of the fall suggests there may have been other non-fundamental factors behind Wednesday’s big drop. Some media reported hopes for a peace deal in the ongoing conflict in Gaza may have been factor, although such sentiment has been floating around for the better part of two weeks.
WTI crude has been rolling over for a while
When you look at the price action prior to the swoon, evidence was accumulating to suggest bullish momentum was starting to ebb. RSI had been trending lower since early April as had MACD, mirroring the price action which rolled over after struggling above $84.70 during a period of elevated geopolitical tension.
The bearish break on April 17, followed up by the tombstone doji that printed two days later, signaled sellers may be gaining the upper hand. And while we saw a bounce last week, the price was unable to reclaim $84.70 before reversing hard through the 50 and 200-day moving averages, along with horizontal support located at $80.30.
The downside flush has seen the price hit uptrend support dating back to mid-December when the Fed pivoted to signalling rate cuts. While bids have kept the price above this key level in Asia, you get the sense Thursday may be an important session for crude’s longer-term trajectory.
WTI trade ideas: let the price tell you what to do
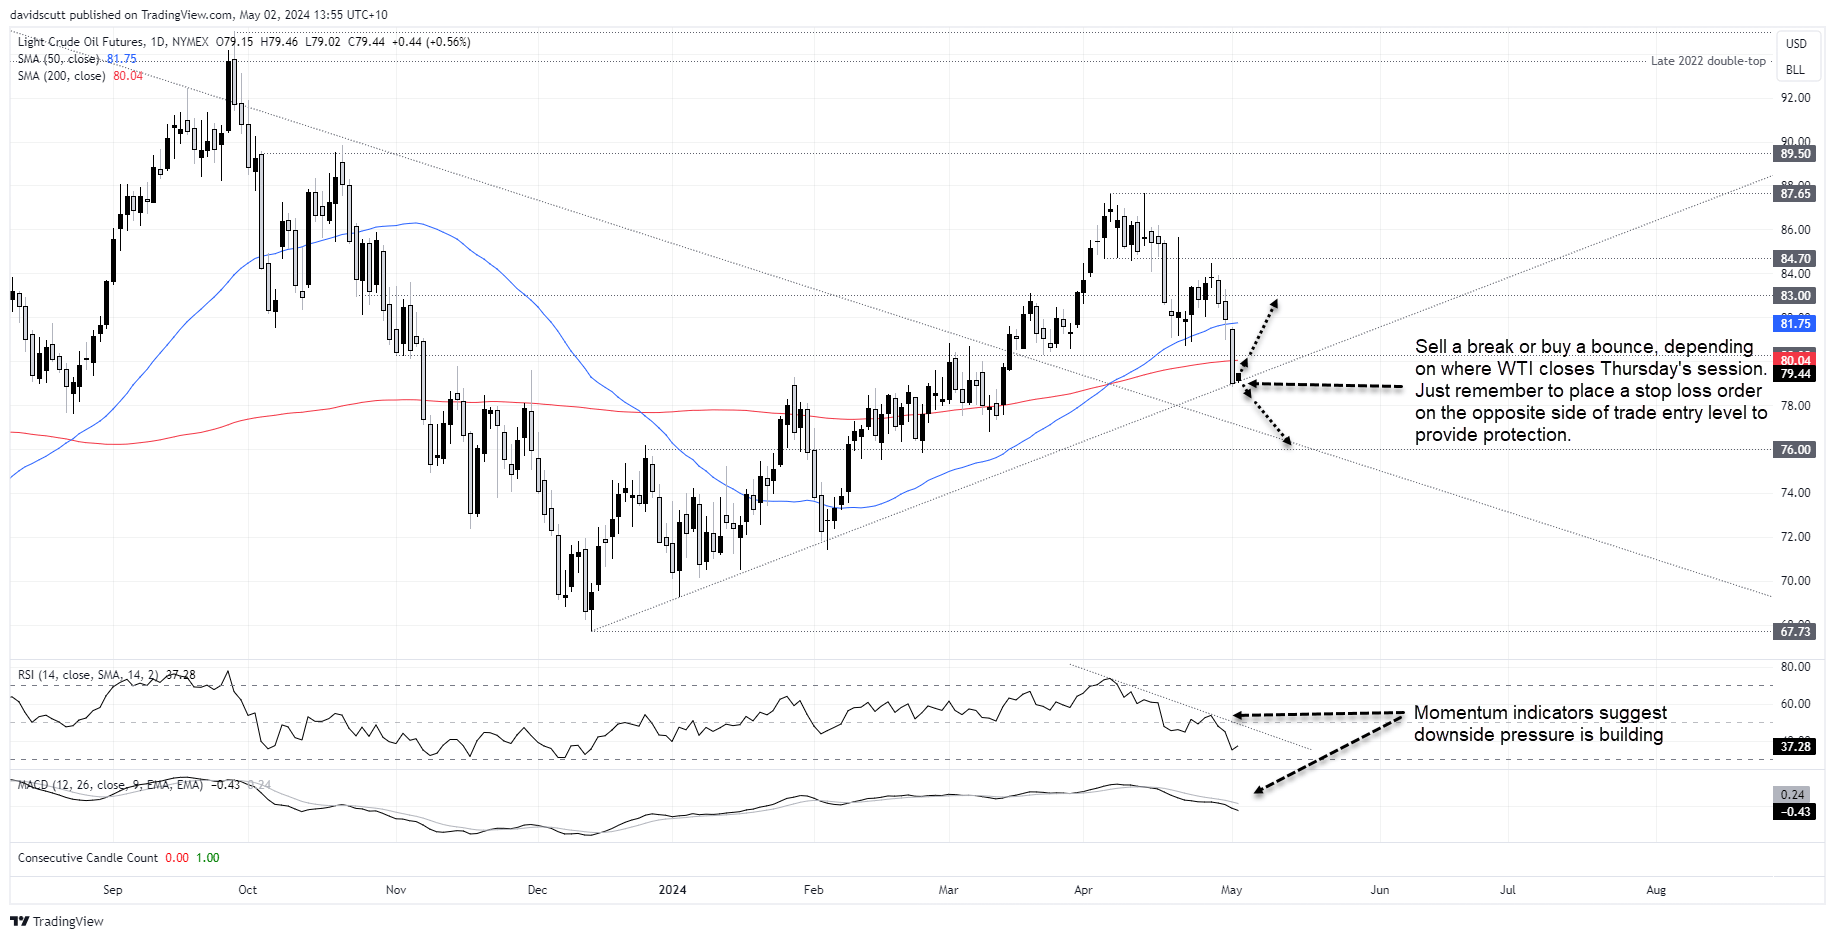
A break lower could see the move extend towards support at $76 with little visible support evident between where the price currently trades. If that were to eventuate, traders could sell the break with a stop loss order above the uptrend for protection. Should the trade move in your favour, you could lower your stop to entry level, providing a free hit on downside.
Alternatively, should the uptrend hold, traders could buy the dip with a stop below for protection. Again, it the bounce were to extend, consider moving your stop to entry level. $80.30 is the first upside target with a push above $84 possible after that should the price overcome the 200-day moving average.
-- Written by David Scutt
Follow David on Twitter @scutty
How to trade with City Index
You can trade with City Index by following these four easy steps:
-
Open an account, or log in if you’re already a customer
• Open an account in the UK
• Open an account in Australia
• Open an account in Singapore
- Search for the market you want to trade in our award-winning platform
- Choose your position and size, and your stop and limit levels
- Place the trade
Latest market news
Yesterday 01:32 PM
Yesterday 09:35 AM
Yesterday 07:23 AM
Yesterday 04:48 AM
Yesterday 12:17 AM
July 25, 2024 10:39 PM
Latest WTI articles

July 25, 2024 05:30 PM

July 18, 2024 12:48 AM

July 10, 2024 03:45 PM
July 9, 2024 05:30 PM