


The rising and falling wedge patterns can provide useful signals of upcoming price action, if you know how to trade them. Find out everything you need to know about wedges.
What is a wedge pattern?
A wedge pattern is a type of chart formation that acts as a continuation signal – meaning it appears during ongoing trends and tells you that after a period of consolidation the market should resume the move.
There are two types of wedge patterns you’ll encounter in the markets:
- Falling wedge patterns (also known as descending wedges) are a bullish continuation signal
- Rising wedge patterns (also known as ascending wedges) are a bearish continuation signal
What is the falling wedge pattern?
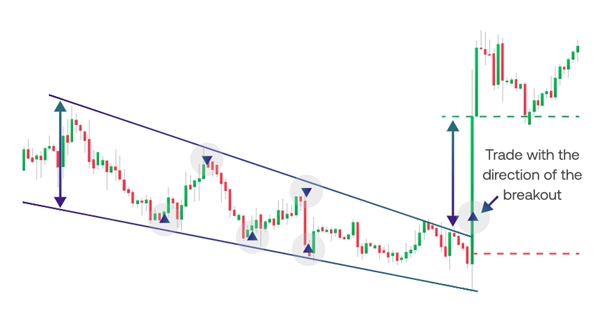
The falling wedge pattern is a candlestick formation that appears on trading charts. Usually appearing after uptrends, falling wedges are considered bullish continuation patterns – meaning that if the formation completes, the original uptrend should resume.
To spot a falling wedge – also called a descending wedge – look for a market that’s moving downwards, but with support and resistance lines that are pointing towards each other (unless you have a broadening wedge, but we’ll cover that later).
Essentially, a wedge looks a bit like a bullish flag or a triangle pattern, except the lines aren’t parallel (like a flag) and neither of them is flat (like a triangle). They work in a similar way to triangles and flags, too. If the market breaks out above the resistance line, then the pattern has completed, signalling a new uptrend.
If it breaks out through support instead, the pattern has failed.
You may sometimes see falling wedges described as reversal patterns, as the falling price action within the wedge reverses once the market breaks out above the resistance line. This is particularly true if you spot a falling wedge that doesn’t follow an uptrend, which is rarer but can arise.
Learn more about candlestick patterns.
How to trade the descending wedge pattern
To trade the descending wedge pattern, you’d look to open a buy position once the market breaks through support, in order to take advantage of the resulting bullish price action. However, a break out doesn’t necessarily mean that an uptrend is definitely on the way – so you’ll want to pay attention to your risk management too.
Typically, traders will wait to confirm the uptrend before executing their order. The simplest way to do this is to wait for the next candlestick after the breakout. If it is green, then bullish momentum may have taken hold; if it is red then it may be best to wait.
You can also use indicators to help confirm the trend. As well as momentum indicators such as RSI and the stochastic oscillator, volume can be a useful gauge of a wedge’s strength. Wedges are often accompanied by falling volume within the pattern, which then returns as the market breaks out.
Placing your stop loss on a falling wedge
Even if you see falling volume, a green confirmation candle and check a momentum indicator before trading, there’s still the chance for the trend to fail when trading wedges. This is why we’d always recommend setting a stop loss when you open your position.
A good rule of thumb is to place your stop at the market’s last significant low – the last time it bounced off the resistance line that forms the bottom of the pattern. If the price moves below this point, then the pattern has clearly failed and it’s time to get out.
You might also want to consider setting a limit order at your profit target. You can use the height of the wedge (at the beginning of the pattern) to give you an idea of the possible size of the resulting move.
What is the rising wedge pattern?
The rising wedge pattern is a formation that looks like the opposite of a falling wedge. A market’s highs and lows form support and resistance lines that are both rising – but point towards one another, indicating a period of consolidation.
Rising (or ascending) wedges don’t just look like the opposite of falling ones. They signify the opposite price action too, with the upward momentum of the pattern itself set to turn into a renewed downtrend if the market breaks down through support.
If the resistance line is broken instead, then the ascending wedge has failed. This may signal a new uptrend.
Rising wedges typically appear after uptrends, acting as a bearish reversal pattern.
Learn more about how to read charts.
How to trade the ascending wedge pattern
To trade the ascending wedge, you take the opposite action to a falling wedge. Instead of buying after the breakout, you sell. And instead of watching the resistance line, you watch support.
You’ll still want to confirm the trend, though, with a red candlestick after the breakout or by looking at indicators.
You’d want to see falling volume within the pattern, the same as within a descending wedge. The lower volume signals that the upward price action seen within the pattern doesn’t have much momentum behind it, making a reversal more likely.
Bear wedge pattern risk management
Here, a common strategy for placing your stop loss is to put it just below the market’s previous high – the last time it tested resistance. Then, if the pattern fails, your position is closed automatically. The height of the wedge can be used to calculate a profit target.
Before trading a wedge, check that your profit target and stop loss conform to your risk-reward ratio. If they don’t, we’d recommend waiting for a different opportunity.
Start wedge pattern trading
Follow these steps to start trading wedges with City Index today:
- Open your City Index account, or log in if you already have one
- Add some funds
- Look for wedge patterns using our advanced technical analysis tools
- Open your buy or sell position
Alternatively, you can practise trading wedges with a cost-free City Index demo account. You’ll get full access to our platform, preloaded with virtual funds. So, you can test out your wedge trading strategy with zero risk.
What is the broadening wedge pattern?
The broadening wedge pattern is a type of wedge that looks a bit different to the ascending and descending variants. Instead of pointing towards each other, the support and resistance lines diverge – hence the ‘broadening’ in the name.
Broadening wedges don’t signify a period of consolidation. Volatility grows throughout the pattern, as bulls and bears battle to take control.
You might sometimes see broadening wedges referred to as expanding wedge patterns.
Trading the expanding wedge pattern
To trade a broadening wedge, you don’t look for a breakout beyond either the support or resistance line. Instead, most traders look to take advantage of the oscillations within the pattern itself to earn a profit.
This can make broadening wedges appealing to swing and day traders, as there is lots of short-term volatility. Longer-term traders and investors, however, can be put off by widening wedges as the volatility isn’t paired with a trend in either direction.
Wedge FAQs
What is a rising broadening wedge pattern?
A rising broadening wedge pattern is a type of expanding wedge in which price action moves upwards between support and resistance lines that a pointing away from each other. You can either trade the movement between the lines, or wait for a breakout in either direction.
Learn more about chart formations.
What is the bear wedge chart pattern?
The bear wedge chart pattern is another name for the rising wedge. Despite the market moving upwards within the formation, a rising wedge indicates a bearish continuation after a breakout through support – hence the name.
Open your City Index account to start trading wedges.
Latest market news
Yesterday 01:32 PM
Yesterday 09:35 AM
Yesterday 07:23 AM
Yesterday 04:48 AM
Yesterday 12:17 AM
July 25, 2024 10:39 PM
Latest Financial market insight articles

June 17, 2024 01:00 AM


March 26, 2024 04:11 AM

November 13, 2023 11:05 AM