


Geopolitical events such as war, natural disasters, or changes in government policy can all impact financial markets, as investors react to new information and adjust their expectations about the future.
In the last couple of years alone, events with a global impact such as the coronavirus pandemic and Russia's invasion of Ukraine, have greatly destabilised the price of stocks and commodities, such as oil, metals and agricultural products.
Destabilising events aren't always welcomed by investors, who try to steer clear of volatility. But for traders, the market movements can create a range of opportunities.
However, volatility also increases risk, and can see the market turn quickly against your trade, resulting in losses.
With City Index, traders can take their position on a variety of markets – such as shares, indices, forex and commodities – with CFDs, and access a range of risk management tools.
With that in mind, let's take a look at the global events that have had the biggest impact on stocks and commodities.
The global events with the biggest negative impact on the stock market
To categorise each of these events, we identified the point when the respective index's price hit its lowest point and calculated the decrease from the start of the event or the pre-event peak.
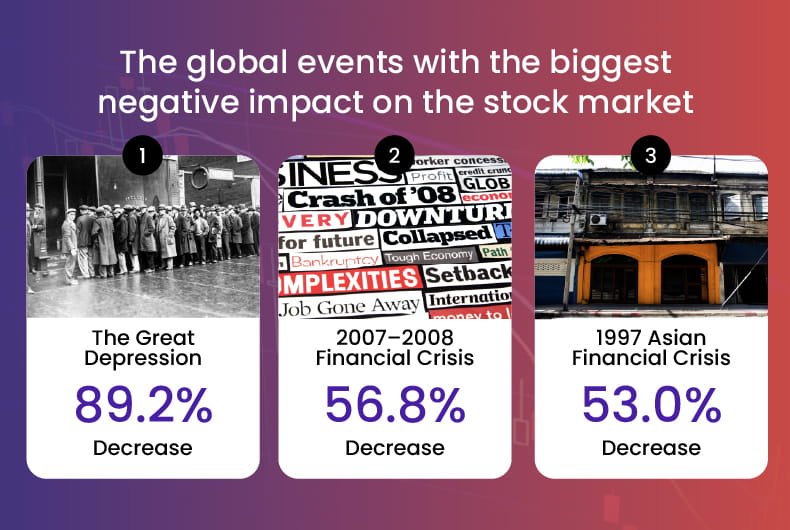
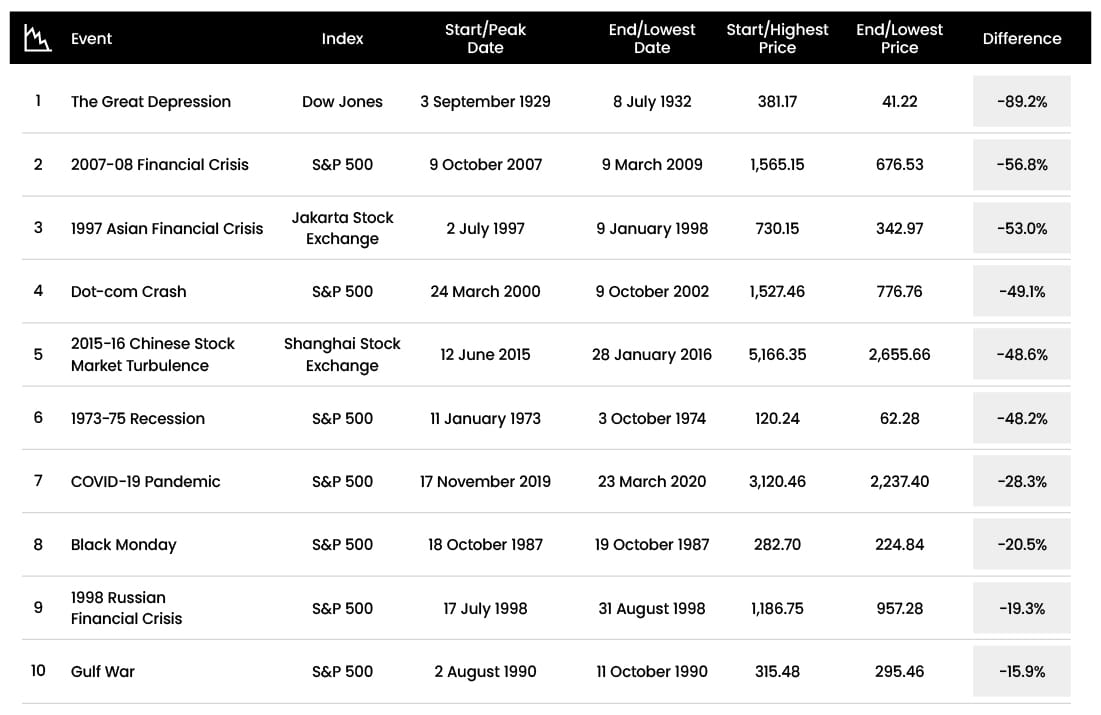
1. The Great Depression – 89.2% decrease
The Great Depression began in 1929 and lasted for nearly a decade. During this severe economic downturn, the Dow Jones Industrial Average (DJIA) – a stock market index that tracks the performance of 30 large publicly-traded companies in the United States – was significantly affected.
In the early years of the Great Depression, the DJIA experienced a sharp decline. From its peak in September 1929 to its low point in July 1932, the DJIA lost about 89% of its value. This dramatic drop started with the Wall Street Crash and led to widespread bank failures, high unemployment, and decreased consumer spending.
The DJIA continued fluctuating during the rest of the Great Depression but did not recover to its pre-Depression levels until the 1950s. The impact of the Great Depression on the DJIA highlights the interconnectedness of the stock market and the broader economy, which also took time to recover.
2. 2007-2008 financial crisis – 56.8% decrease
The 2007-2008 financial crisis had a significant impact on the S&P 500, a stock market index that tracks the performance of 500 large companies listed on US stock exchanges. The crisis, which was triggered by the subprime mortgage market collapse, led to a global recession and caused a sharp decline in the S&P 500 index.
Starting in late 2007, the S&P 500 began a downward trend that would continue for over a year. By March 2009, the index had lost more than 50% of its value from its peak in October 2007, reaching its lowest point at 676.53 on March 9, 2009. This was the lowest level the index had traded at since the mid-1990s.
The decline was due to several factors, including the collapse of the housing market, a credit crunch that made it difficult for businesses to obtain financing, and a decrease in consumer spending. The crisis had a ripple effect throughout the economy, leading to job losses, business closures, and a decrease in overall economic activity.
Over time, the S&P 500 gradually recovered from the crisis, reaching its pre-crisis level in March 2013. Since then, the index continued to rise, setting new record highs in the years following the crisis, before events – such as the war in Ukraine – stalled its growth.
3. 1997 Asian financial crisis – 53% decrease
The 1997 Asian financial crisis had a significant impact on stock indexes across the continent, particularly the Jakarta Stock Index (JSX).
The JSX was one of the worst-performing stock markets in the region during the crisis, declining more than 50% from its peak in 1997. The fall was triggered by several factors, including a sharp devaluation of the Thai baht, which led to a widespread loss of confidence in the region's currencies and financial systems.
In Indonesia, the crisis was exacerbated by an already weak economy, with high levels of foreign debt, and a series of political and social challenges. As a result, foreign investors fled the Indonesian market, leading to a sharp decline in the value of stocks on the JSX.
Despite the severity of the crisis, the Indonesian economy eventually recovered, and the JSX gradually regained some of its lost value in the years that followed. However, the experience had a lasting impact on the country's economic and political landscape, and many of the reforms implemented in the aftermath of the crisis continue to shape Indonesia's economic policies today.
Global events that had a positive impact on the stock market
However, not all global events harm stocks. Some can stimulate the market and inflate share prices. Here are the events that resulted in stock indices experiencing the biggest price increases.
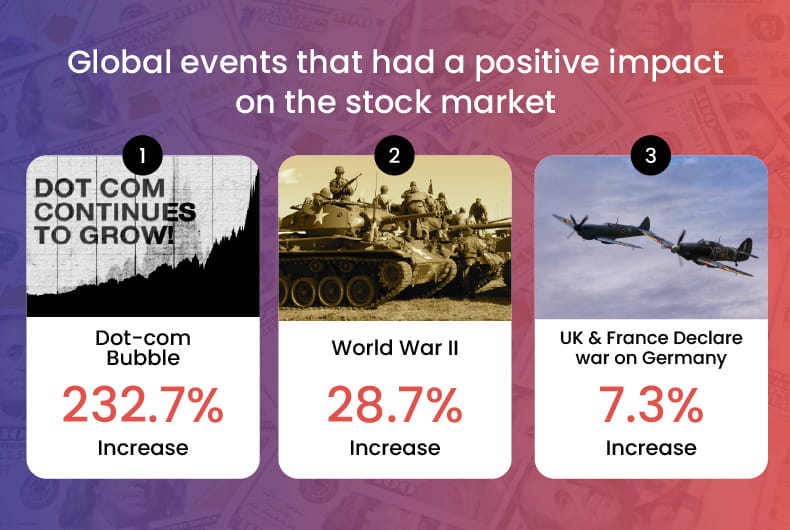
1. Dot-com bubble – 232.7% increase
The dot-com bubble was a period of excessive speculation on and investment in internet-related companies in the late 1990s, which led to a rapid rise in the stock prices of many companies in the sector.
During the late 1990s, the technology sector, which was heavily represented in the S&P 500, experienced a significant increase in valuations. As a result, the S&P 500, driven by this sector rose sharply during this time, reaching a peak in March 2000, up over 232% from the start of 1995.
However, as the Dot-com bubble burst in the early 2000s, many of these internet-related companies began to fail or experience significant declines in their stock prices. Ranking as the fourth-worst event in the table above for its impact on the stock market, the Dot-com crash had a major impact on the broader US economy, with many internet-related companies failing, and investors losing a significant amount of money. The aftermath led to a period of caution and more conservative investment strategies in the US stock market.
2. World War II – 28.6% increase
World War II had a significant impact on the DJIA, as it did on many other aspects of the global economy. In the early years of the war, the DJIA experienced significant volatility, as investors reacted to the uncertainty and disruption caused by the conflict.
In the months leading up to the United States' entry into the war in December 1941, the DJIA experienced a sharp decline, as investors anticipated the impact that the conflict would have on the economy. The day after the attack on Pearl Harbor, the DJIA fell by more than 3.5%.
However, as the war progressed, the DJIA began to recover, as the United States ramped up its production of military equipment and supplies. Most economic historians also consider that war-related rearmament, mobilisation and increased government spending contributed to the end of the Great Depression, which had severely impacted the US economy and ranked as the event with the greatest negative impact. Many companies that were part of the DJIA benefited from this increased demand, and their stock prices rose as a result, increasing by 28% between the first and last days of the war.
3. The UK & France declare war on Germany – 7.3% increase
Looking towards the beginning of World War II, the UK and France formally declared war on Germany in September 1939, the DJIA increased by 7.3% from the last day of trading after the war was declared to the first trading day after.
Although at this stage the United States was not involved in the conflict, this jump could be linked to US businesses benefitting from increased demand from countries at war.
By the end of the year, the DJIA had risen by about 10% from its pre-war levels.
How have recent events impacted commodity prices?
Here we've taken a look at how two of the biggest events of the 2020s so far have affected the commodity market.
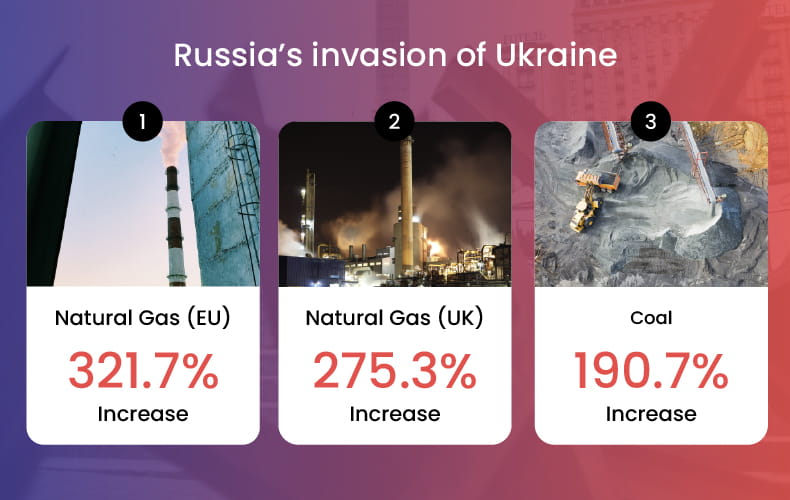
After weeks of build-up, Russia invaded Ukraine on February 24, 2022. This drove up the prices of many commodities, especially natural gas and coal.
We took the price of each commodity on the first day of trading in 2022 and compared this to the date at which it peaked in the months since.
1. Dutch TTF Gas Futures – 321.7% increase
Russia is a major supplier of natural gas, accounting for 16.6% of the global supply in 2020 and around 45% of Europe's gas imports came from the country.
With that supply now disrupted, the price of Dutch TTF Gas futures has seen a considerable increase, jumping by over 321% from the start of January to August 26, 2022.
European countries were particularly reliant on Russian gas, through sources such as the Nord Stream pipeline, which is why they've been hardest hit.
2. UK Natural Gas Futures – 275.3% increase
However, it's not just mainland Europe that has been hit by the lack of natural gas supply from Russia, with prices on Natural Gas Futures in the UK jumping by 275.3%, peaking on the same day as the EU.
While the UK isn't as directly dependent on Russian gas as other countries in Europe, it has still been heavily affected by the conflict.
Energy bills in the UK were already rising before the invasion, and they have now soared to all-time highs, peaking in March 2023.
3. Coal – 190.7% increase
Coal is another commodity that is linked to energy production and has similarly been hit by the invasion. Prices increased by 190.7% from the start of 2022 to September 5.
The EU prohibited the import of Russian coal in August 2022, which could have contributed to the price peaking the following month.
Global coal supplies were already tight before the invasion and Russia was the world's third-largest exporter before the invasion.
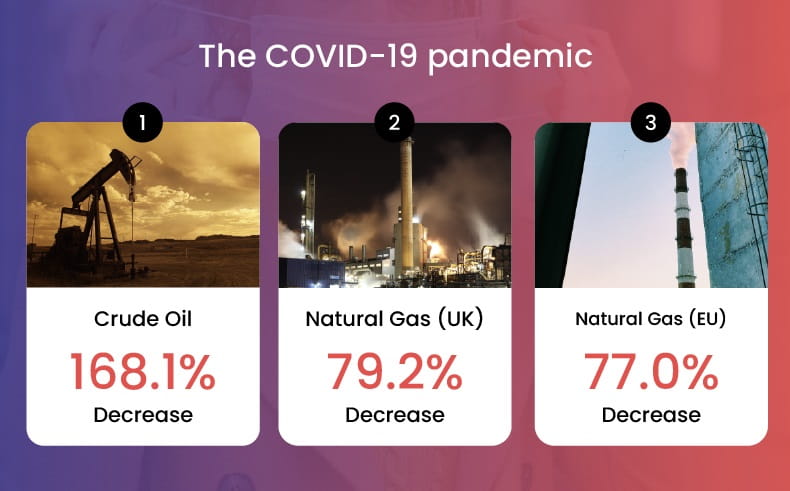
The other event that had a far-reaching impact on global markets in recent years was the COVID-19 pandemic. Commodities reacted differently to the onset of the pandemic, creating significant uncertainty, while the majority dropped in price, some commodities have recovered much more quickly than others.
Here, we've looked at the first trading days after the first case was discovered (November 17th 2019) and compared these prices to the day they were at their lowest in 2020.
1. Crude oil – 168.1% decrease
The lack of travel and transport due to stay-home orders during the pandemic caused decreased demand for oil and led to oversupply in the market.
There was a significant decrease on April 20, 2020, when prices dropped below zero for the first time in history, 168.1% lower than on the day that the first COVID case was discovered.
This was primarily caused by a lack of storage capacity, due to low usage, as an overwhelming supply influx left buyers reluctant to purchase oil due to insufficient storage or sell-on options.
2. UK Natural Gas Futures – 79.2% decrease
Natural gas was also hit hard by the pandemic, with the lack of industrial activity and lower energy consumption leading to a lack of demand.
In the UK, this meant a drop in prices of 79.2%, which was exacerbated by a mild winter in the country for 2020-21.
3. Dutch TTF Gas Futures – 77% decrease
Mainland Europe experienced a similar decline in industrial and commercial activity and saw a decline in natural gas prices of 77% between the start of the pandemic and May 2020.
However, as nations opened up again, demand for gas bounced back, as did prices, following that initial slump.
In fact, by the end of 2020, Dutch TTF Gas prices had surpassed the point they were at in November 2019, when the first case was discovered.
While global events can present opportunities for profit due to market fluctuations, they also come with a higher level of uncertainty and risk.
By staying informed about global events and understanding their potential impact on financial markets, traders can better appreciate how their trading strategies are affected by volatility.
By providing access to various financial instruments and up-to-date market analysis, City Index helps traders make informed decisions and find opportunities in market fluctuations driven by global events whether trading shares, forex or commodities.
Methodology
For each event, we identified a date when stock prices for the relevant index peaked, either on the day of the event or in the days or weeks preceding it.
We then identified a date when stock prices either reached their lowest point or when the event ended.
Closing prices for each of these dates were taken from TradingView.
Commodity prices were all sourced from Trading Economics.
For Russia's invasion of Ukraine, the first day of trading for 2022 was used and compared against the highest point between that date and the present day (March 9, 2023).
For the COVID-19 pandemic, the first trading day after the first case was discovered was used as the starting point (November 17, 2019). This was then compared to the day the commodity hit its lowest point between that date and the end of 2020.
Latest market news
Yesterday 01:32 PM
Yesterday 09:35 AM
Yesterday 07:23 AM
Yesterday 04:48 AM
Yesterday 12:17 AM
July 25, 2024 10:39 PM
Latest Stock Market articles

February 27, 2024 01:52 PM

December 21, 2023 04:35 PM

October 23, 2023 02:20 PM

October 23, 2023 11:09 AM