


Bitcoin Key Points
- A “physical” Bitcoin ETF in the US appears to be more of a question of when than if now.
- Unlike futures-based products, physical ETFs fundamentally alter the supply/demand balance in a bullish way.
- Technically speaking, BTC/USD will have a bullish bias as long as it holds above $32K, with room toward $36K next.
Bitcoin Fundamental Analysis
After a long summer lull, optimism and volatility have returned to the crypto markets.
The proximate catalyst for the latest leg higher in Bitcoin has been speculation of the approval of a “physical” Bitcoin ETF in the US. After a series of embarrassing legal losses, the SEC is seen as likely to approve a(t least one) Bitcoin ETF, with Cathie Wood’s ARK Invest application at the front of the line. Meanwhile, news that industry bellwether Blackrock had listed its IBTC ticker on the Depository Trust and Clearing Corporation website, an essentially precursor to listing a new ETF, bolstered the case that an approval may come sooner rather than later.
Unlike previous high-profile “mainstream” crypto launches such as futures contracts at the CME and a futures-based ETF that marked near-term highs in the crypto market, a “physical” ETF would have to buy and hold Bitcoin equal to its assets under management, altering the fundamental supply and demand balance in the market. Of course, markets are already frontrunning this possibility, so there is still potential for a “buy the rumor, sell the news” reaction whenever an ETF is formally approved, so readers shouldn’t automatically assume the current rally will extend from here.
With Bitcoin entering an historically bullish period of its 4-year halving cycle and major central banks seemingly nearly done raising interest rates, there are bigger picture tailwinds for the price of the world’s largest cryptoasset as well.
Bitcoin Technical Analysis – BTC/USD Daily Chart
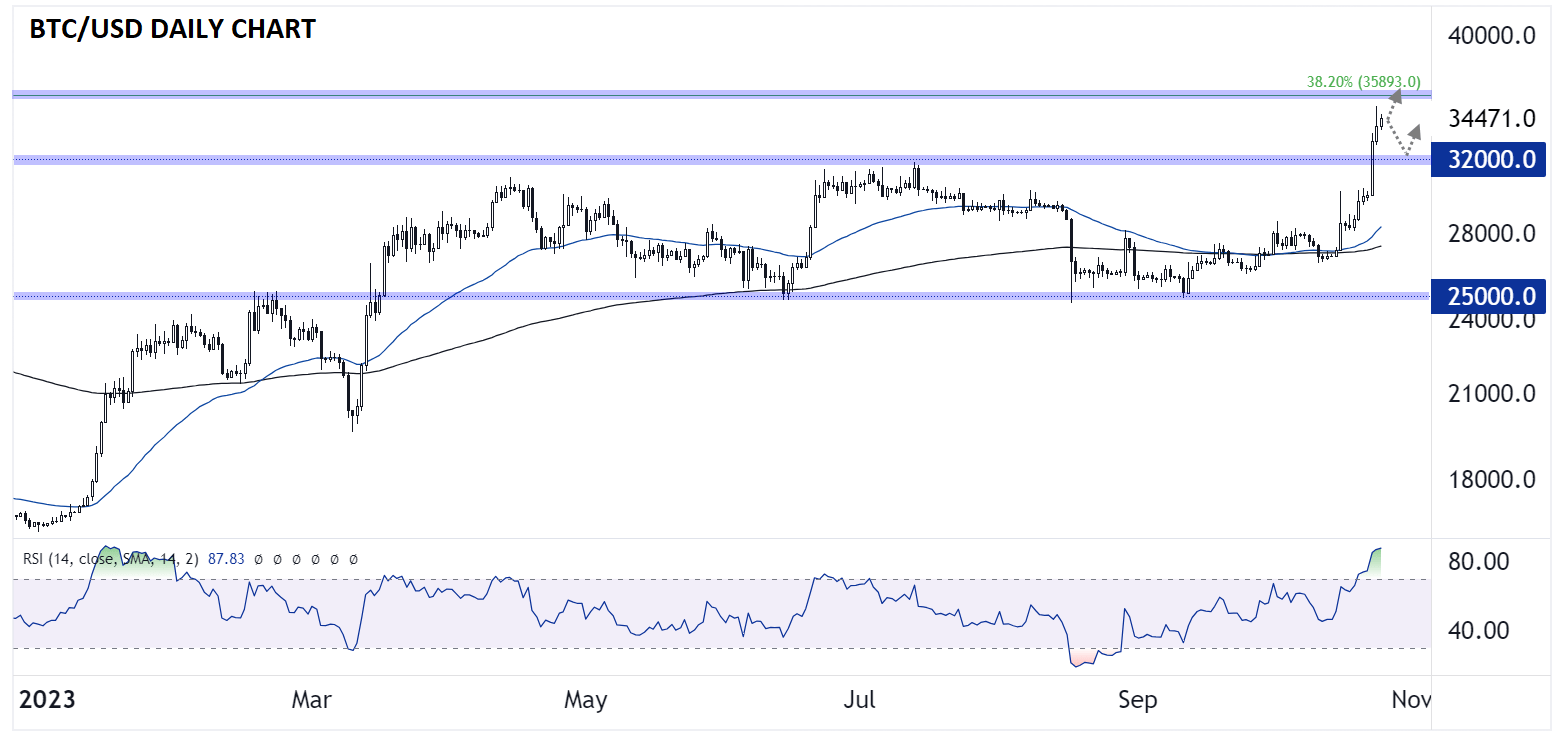
Source: TradingView, StoneX
As the chart above shows, Bitcoin has seen a big breakout above $32K to its highest level in nearly 18 months. The topside breakout follows a relatively shallow 38.2% pullback of the rally over the first half of the year, suggesting that the medium-term momentum remains with the bulls. As long as Bitcoin holds its breakout above the $32K area, there is room for continued strength toward $36K, the 38.2% retracement of the whole Nov. ’21 – Nov ’22 drop, followed by the $40K psychological level next.
Only a break back below $32K would erase the near-term bullish bias at this point.
-- Written by Matt Weller, Global Head of Research
Follow Matt on Twitter: @MWellerFX
Latest market news
Today 12:52 PM
Today 07:49 AM
Latest Bitcoin USD articles

April 24, 2024 05:45 AM
April 15, 2024 07:13 PM
April 9, 2024 01:15 AM

March 21, 2024 11:48 PM