


Australian Dollar Talking Points:
- AUD/USD was flying high into late-December trade, but bears have made a loud re-appearance back into the pair.
- Price has begun to test a confluent spot of support around the .6596 level, which is confluent with the 200-day moving average. That area has so far helped to hold the lows for today, but the big question now is whether it can help to turn the tide of the bearish trend that’s appeared in the past few weeks.

It was a remarkably indecisive year of 2023 for AUD/USD. The first trade of the year was at .6817 and the final trade was at .6811, making for a whopping 6-pip range over the course of 2023 trade. There was, of course, some intermediate-term trends to work with and with a range of almost 900 pips, it’s not like the pair was just sitting still for the entire time. But – this would be the smallest yearly move for the pair since before 2006, and when there has been a year of indecisive price action since then, there’s been a tendency for volatility to follow.
There was a doji in 2011 and another in 2012 which led to a precipitous decline from 2013-2015. There was another doji printing in 2016 and that led to a strong bounce in 2017, which was then wiped out by another sell-off in 2018. Another doji appeared in 2019 which led to the rollercoaster that showed in price action through 2020 trade.
On the below yearly chart of AUD/USD I’ve highlighted each of those yearly dojis, but I’ve also added a blue box where there’s been a tendency for support to develop over this period, around the .6300 handle.
AUD/USD Yearly Chart: A Quiet 2023, Will Volatility Follow?
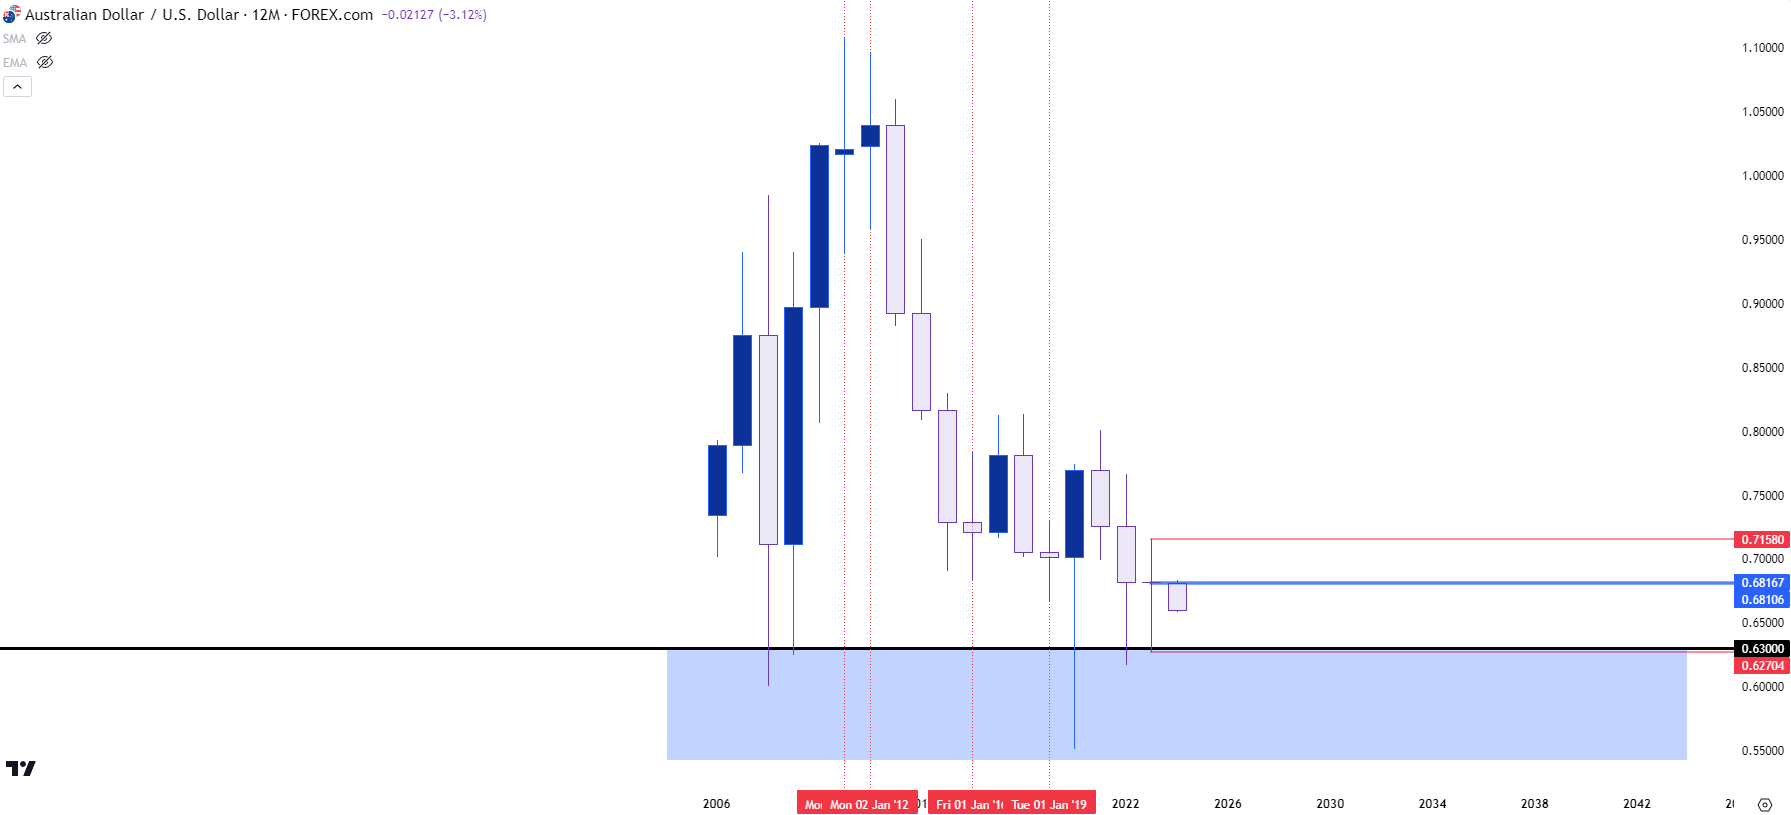 Chart prepared by James Stanley, AUD/USD on Tradingview
AUD/USD Weekly
It will probably come as little surprise given the above chart that the weekly outlay in AUD/USD has shown digestion of late. There’s a trend channel that’s guided price action for the pair since 2021 (in red) and there’s a bearish trendline that had held the highs through 2022 and the first 11 months of 2023. I’ve plotted that in black on the below chart, and you’ll probably notice that it’s come back into the picture, this time as support after the pullback has deepened to begin 2024 trade.
There’s another item of support, plotted in blue on the below graphic, which is the 200-day moving average. I had written an article on this topic last week, highlighting the utilitarian nature of this indicator. It’s often used for diagnosing trends, but it can also assist with support and/or resistance. This is the type of item that can get traders’ and market participants’ attention, with the big question as to whether a 200DMA test will bring on buyers and a change in price flow.
AUD/USD Weekly Chart
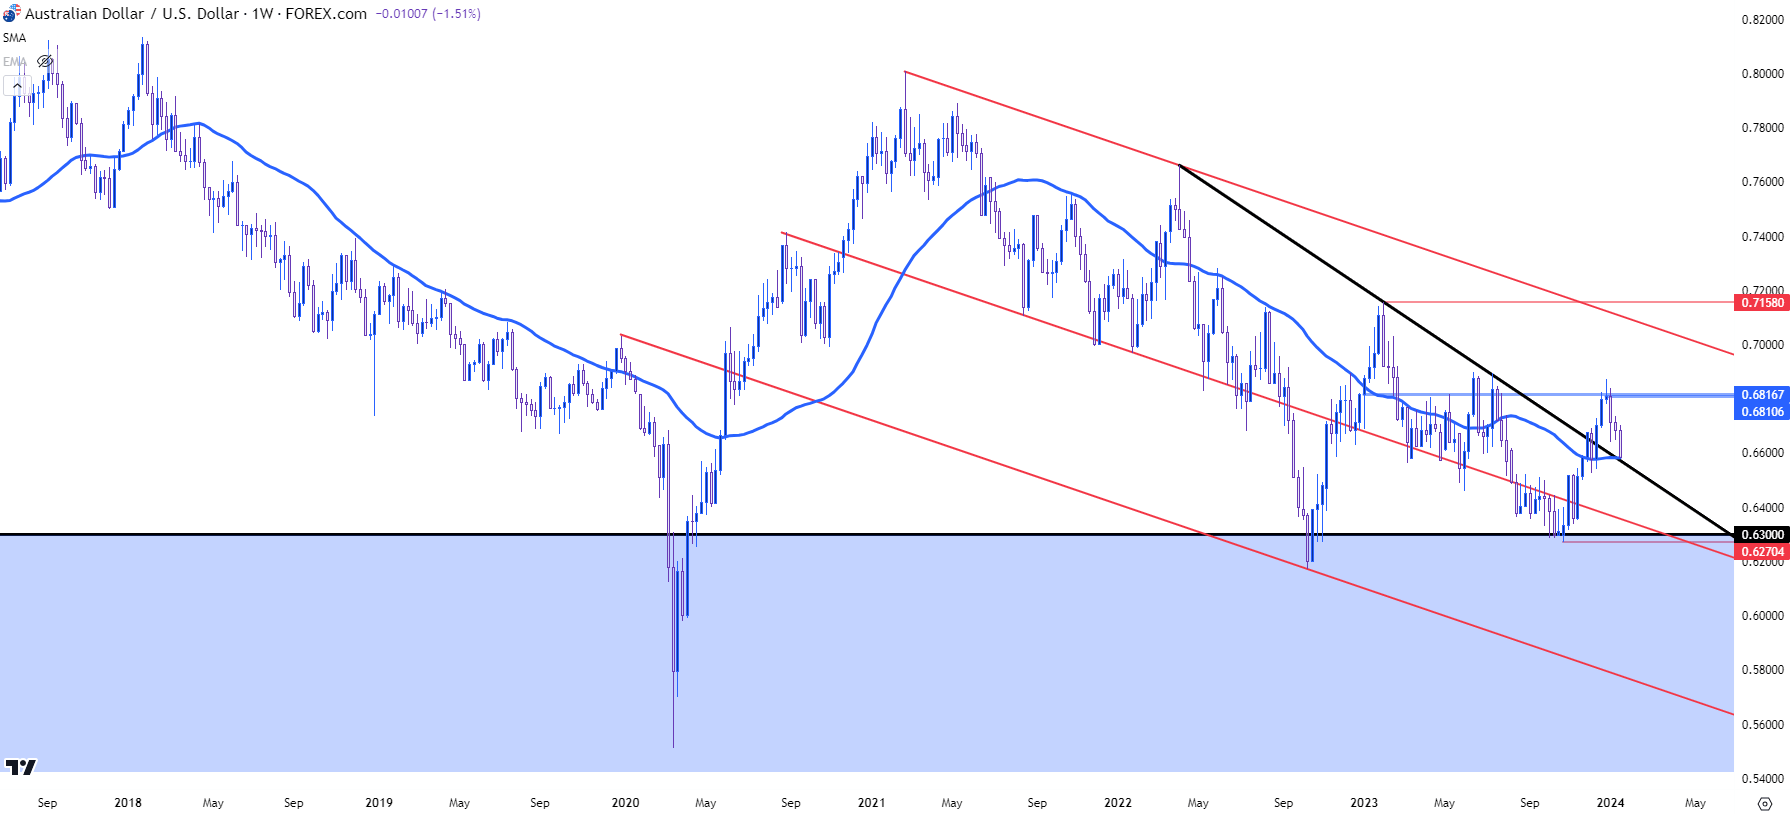 Chart prepared by James Stanley, AUD/USD on Tradingview
AUD/USD Daily
From the daily chart the recent trend looks like a falling knife. Despite the possible support that may be setting up, there’s little evidence yet showing that sellers are done; and as of this writing AUD/USD is working on its worst daily outing in more than three months. But – given the support that’s already in the picture along with some nearby support that’s just a little lower, this could be a theme of interest to track for this week. This could be of particular interest to USD-bears that might be looking to take the other side of the recent breakout in DXY.
On the daily chart below, we can see AUD/USD testing below that trendline projection and beginning to touch the 200-day moving average. There’s also a spot running from .6500 up to .6523 that also has a claim for support, as this was a spot of resistance-turned-support that’s also confluent with the 61.8% retracement of the bullish trend that developed late last year, which wiped out the earlier-year loss to close AUD/USD as a doji for 2023.
If sellers do remain on attack, and price pushes below the .6500 handle, the next major spot of support would be the item touched on at the top of this article, the longer-term zone that started around the .6300 handle. From the below chart, we can see where that zone held the lows for almost a full month before last year’s rally developed; and that remains a key spot for longer-term charts in the event that the current sell-off continues, and support is unable to shift the tide.
AUD/USD Daily Price Chart
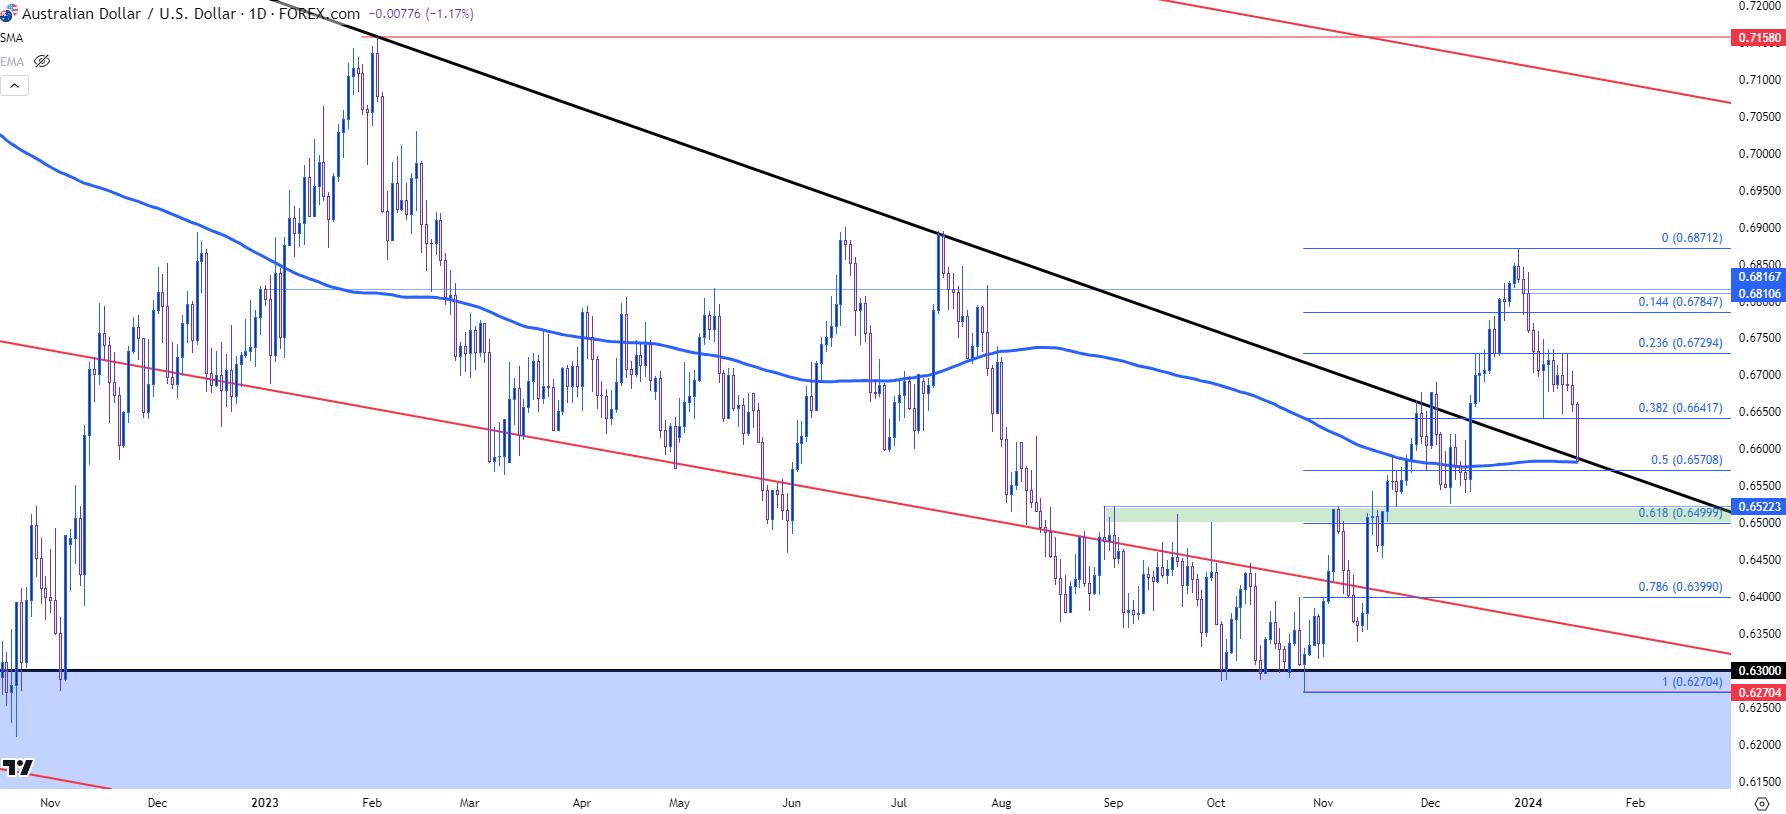 Chart prepared by James Stanley, AUD/USD on Tradingview
--- written by James Stanley, Senior Strategist
Latest market news
Yesterday 01:32 PM
Yesterday 09:35 AM
Yesterday 07:23 AM
Yesterday 04:48 AM
Yesterday 12:17 AM
July 25, 2024 10:39 PM
Latest James Stanley articles

May 25, 2024 08:00 PM
May 4, 2024 08:00 PM

April 28, 2024 08:00 AM
March 29, 2024 10:00 PM