


May 5, 2022 12:45 AM

The FOMC is widely expected to increase interest rates by 50 bps when it meets later today. In addition, it is expected to announce that it will begin easing its $9 trillion balance sheet, reducing by $95 billion per month, consisting of $60 billion of Treasures and $35 billion of MBS. See my colleague Matt Weller’s complete FOMC preview here.
If the outcome from the meeting is “as expected”, there may be little reaction from the S&P 500, as there won’t be any forecast revisions on growth and inflation until the June meeting. If anything, we may see a “buy the fact” given the large cap index has been so depressed during the month of April. However, the key to the next move in the S&P 500 may come from the press conference. 50bps hikes are priced in for the next 3 FOMC meetings. If Powell is more dovish and suggests that this is too aggressive, the S&P 500 could bounce, as it will mean lower rates for longer. However, if he eludes to the possibility of a 75bps increase at one of the next several meetings, as St Louis Fed President Bullard has suggested, stocks may continue to move lower.
Everything you need to know about the Federal Reserve
The S&P 500 index had been rising in ascending wedge since the Fall of 2020 and put in an all-time high of 4820.2 on January 4th. The large cap index then broke below the wedge on January 18th and traded to a near-term low of 4104.1 on February 24th. Price then bounced during the second half of March from 4135.9 all the way to 4636. However, during April, the market sold off and gave back all those gains. On May 2nd, the S&P 500 made a new low of 4062 and bounced to form a hammer on the daily timeframe. This would suggest a bounce is ahead. In addition, price also held just above the 50% retracement level from the lows of October 30th, 2020 to the highs of January 4th, which crosses at 4027. Also, the RSI is diverging with price, suggesting a bounce in the S&P 500 may be ahead.
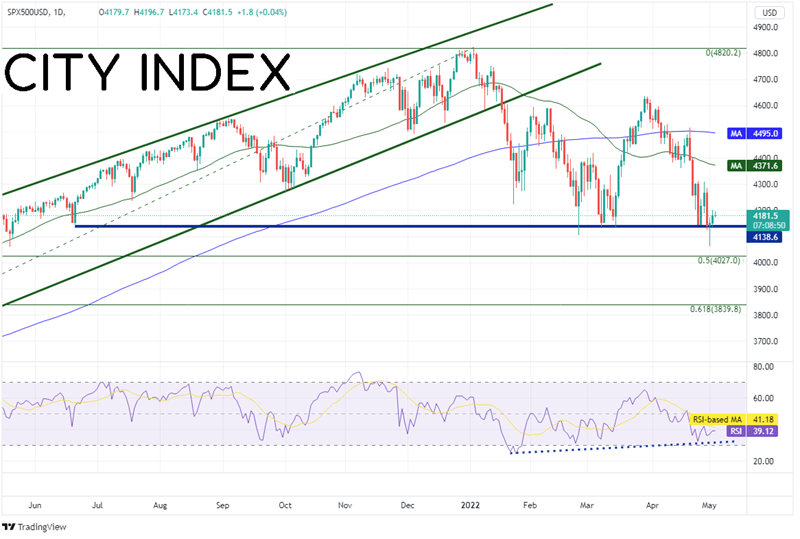
Source: Tradingview, Stone X
Trade SPX 500 now: Login or Open a new account!
• Open an account in the UK
• Open an account in Australia
• Open an account in Singapore
On a 240-minute timeframe, the S&P 500 has been trading lower since the beginning of April in an orderly downward sloping channel. If the index does continue lower, first support is at the lows of May 2nd at 4062. Below there, the next support is the previously mentioned 50% retracement level from the daily timeframe at 4027, then horizontal support dating back to March 2021 near 3991.6. If the S&P 500 Index breaks higher, first resistance is the top, downward sloping trendline of the channel near 4200. Above there, price can trade to the 38.2% Fibonacci retracement from the highs of March 29th to the low of May 2nd, near 4281.2, then the 50% retracement level from the same timeframe at 4349.
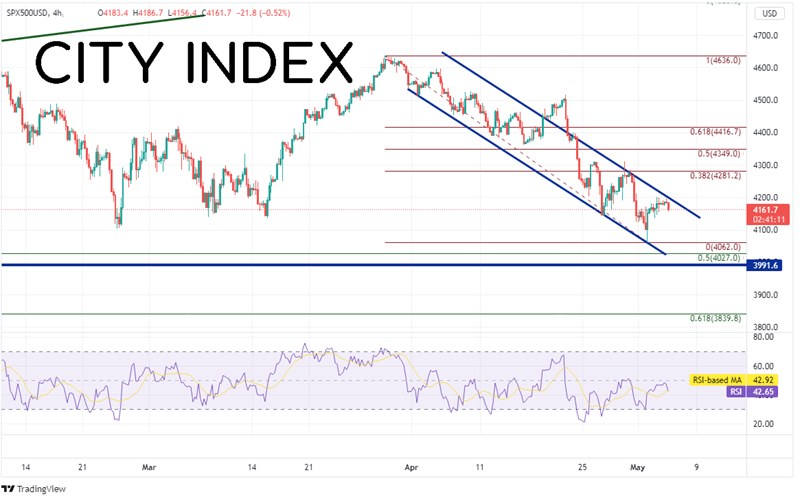
Source: Tradingview, Stone X
The result of today’s FOMC meeting has potential for volatility in the S&P 500 index. If the ultimate outcome is more dovish, the index has quite a bit of room to rally. However, if it is more hawkish, the downside may be limited, as future interest rate hikes are already priced in. Trade cautiously around the meeting!
Learn more about index trading opportunities.
Latest market news
Yesterday 01:32 PM
Yesterday 09:35 AM
Yesterday 07:23 AM
Yesterday 04:48 AM
Yesterday 12:17 AM
July 25, 2024 10:39 PM
Latest SPX 500 articles

July 25, 2024 01:30 PM

July 23, 2024 11:45 AM

July 22, 2024 02:12 PM

July 18, 2024 11:35 AM