January 10, 2023 7:52 PM

Mexico CPI remains high. After reaching a peak of 8.70% in both August and September, Mexico’s CPI deceleration stalled in December at a reading of 7.82% YoY vs a November print of 7.8% YoY. However, the Core CPI fell from a peak of 8.51% YoY in November to 8.35% YoY in December. What does this mean for the Bank of Mexico (Banxico)? Recall that Banxico has been in lockstep with the US Federal Reserve regarding its interest rate hikes since early last summer. US inflation peaked in July, while Mexico’s inflation peaked in September. However, December’s US CPI is expected to continue to fall again to 6.5% YoY when it is released on Thursday vs 7.1% YoY in November. In addition, the Fed is expected to hike rates by 25bps on February 1st. If the US CPI comes out “as expected” at 6.5%, there will now be a larger gap between Mexico’s inflation (at 7.82%) vs US inflation. Will the Bank of Mexico be forced to hike another 50bps, despite the US possibly only hiking 25ps?
Since the markets opened on January 3rd, USD/MXN has not had a positive daily close. Price has moved from 19.5206 down to current price near 19.0619, a loss of roughly 2.15%. Additionally, USD/MXN has made a lower close on 11 of the last 14 trading days. Currently, price is closing on the lows from November 29th, 2022, at 19.0400. If price does break the November 29th lows, the next support level isn’t until 18.8234, which is the lows from February 2020. Below there, price can fall to 17.9315, which is the low from April 2018 and the bottom trendline of the downward sloping channel dating to December 2021.
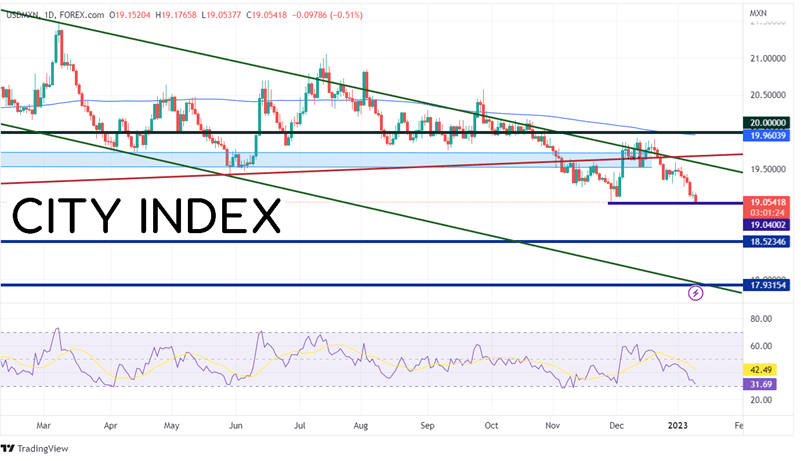
Source: Tradingview Stone X
Trade USD/MXN now: Login or Open a new account!
• Open an account in the UK
• Open an account in Australia
• Open an account in Singapore
On a 240-minute timeframe, the RSI is diverging with price, an indication that price may be ready for a bounce. If the recent lows do hold, first resistance is at the top trendline of a shorter-term channel that USD/MXN has been in since the beginning of the year and horizontal resistance at 19.2573. Above there, resistance is at the highs of January 6th near 19.3490, then again at the highs of December 30th at 19.5888.
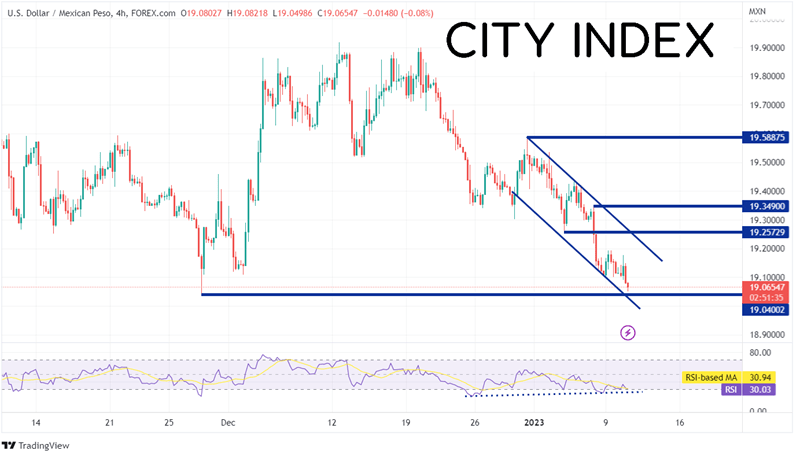
Source: Tradingview Stone X
The US releases CPI on Thursday. If the print is as-expected or lower-than-expected, the Bank of Mexico may have to break the peg of rate hikes to that of the FOMC. Therefore, watch for USD/MXN to move lower if Banxico keeps a more aggressive rate hike stance than that of the Federal Reserve.
Learn more about forex trading opportunities.
Latest market news
Yesterday 01:32 PM
Yesterday 09:35 AM
Yesterday 07:23 AM
Yesterday 04:48 AM
Yesterday 12:17 AM
July 25, 2024 10:39 PM
Latest Trade Ideas articles

Yesterday 09:35 AM

Yesterday 12:17 AM

July 25, 2024 10:39 PM

July 25, 2024 05:30 PM